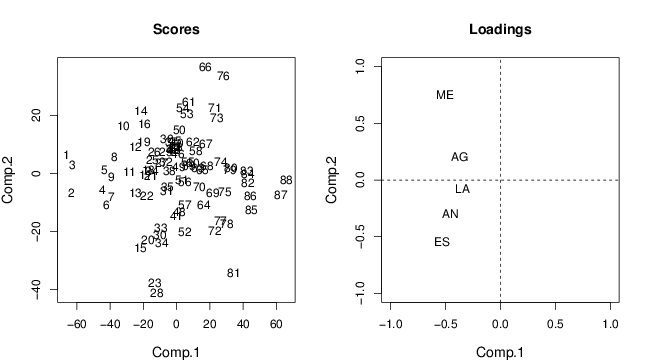
data(scor,package="bootstrap")
pca=princomp(scor)
pdf("pca2.pdf",width=9,height=5)
par(mfrow=c(1,2))
par(mar=c(4,4,4,2))
plot(pca$scores[,1:2],type="n",cex.lab=1.2)
text(pca$scores[,1:2],labels=1:88)
title("Scores")
plot(pca$loadings[,1:2],type="n",cex.lab=1.2,
xlim=c(-1,1),ylim=c(-1,1))
text(pca$loadings[,1:2],labels=names(scor))
abline(h=0,lty=2)
abline(v=0,lty=2)
title("Loadings")
dev.off()
################################################################################
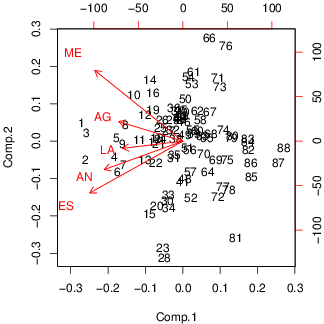
# Biplot
pca=princomp(scor)
pdf("pca3.pdf",width=4.5,height=4.5)
par(mar=c(4,4,2,2))
biplot(pca)
dev.off()