################################################################################
# Scree plot
#load("~/daten/test/pruefdat.RData")
data(scor,package="bootstrap")
pruef <- scor
names(pruef) <- c("ME","AG","LA","AN","ES")
names(scor) <- c("ME","AG","LA","AN","ES")
p=ncol(pruef)
pca=princomp(pruef)
v=pca$sdev^2/sum(pca$sdev^2)
pdf("pca1.pdf",width=9,height=4.5)
par(mfrow=c(1,2))
par(mar=c(4,4,4,2))
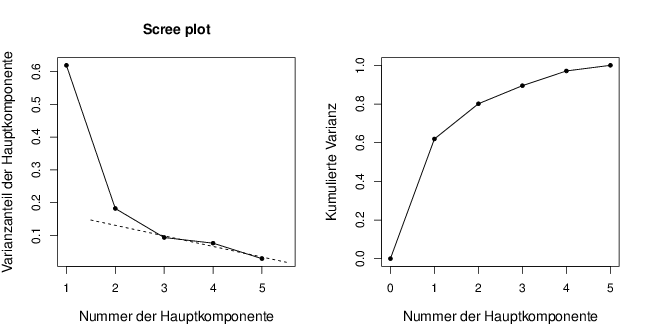
plot(1:p,v,xlab="Nummer der Hauptkomponente",xlim=c(1,5.5),
ylab="Varianzanteil der Hauptkomponente",cex.lab=1.2,pch=20)
title("Scree plot")
lines(1:p,v)
xx=c(3,4,5)
yy=v[3:5]
mod=lm(yy~xx)
co=mod$coef
segments(1.5,co[1]+co[2]*1.5,5.5,co[1]+co[2]*5.5,lty=2)
vc= c(0,cumsum(v))
plot(0:p,vc,xlab="Nummer der Hauptkomponente",xlim=c(0,5),
ylab="Kumulierte Varianz",cex.lab=1.2,pch=20)
lines(0:p,vc)
dev.off()