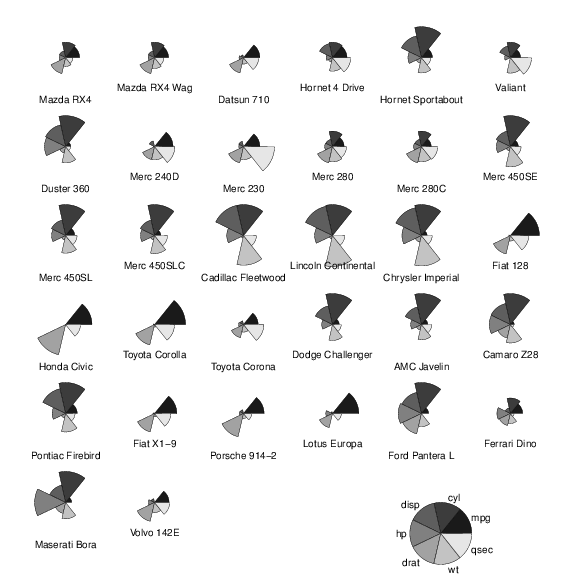
# Segments
data(mtcars)
pdf("multigr6.pdf",width=8,height=8)
par(mar=c(6,1,0,1))
stars(mtcars[, 1:7], len = 0.8, key.loc = c(12, 1.5),
draw.segments = TRUE, col.segments=gray(seq(from=0.1,to=0.9,length=7)))
dev.off()
|
|
# Darstellung multivariater Daten:
# Segments data(mtcars) pdf("multigr6.pdf",width=8,height=8) par(mar=c(6,1,0,1)) stars(mtcars[, 1:7], len = 0.8, key.loc = c(12, 1.5), draw.segments = TRUE, col.segments=gray(seq(from=0.1,to=0.9,length=7))) dev.off() |