data(VADeaths, package = "datasets")
pdf("multigr4.pdf",width=5,height=5)
par(mar=c(4,4,2,1))
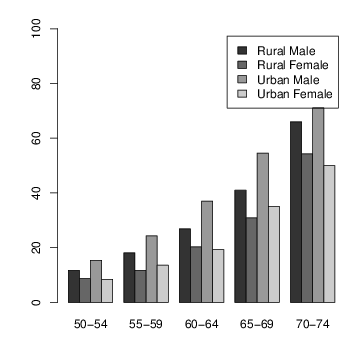
barplot(t(VADeaths), beside = TRUE,
# col = c("lightblue", "mistyrose", "lightcyan",
# "lavender", "cornsilk"),
col=gray(c(0.2,0.4,0.6,0.8)),
legend = colnames(VADeaths), ylim = c(0, 100))
#title(main = "Death Rates in Virginia", font.main = 4)
dev.off()
# Profile (bar plots)
data(VADeaths, package = "datasets")
pdf("multigr3.pdf",width=5,height=5)
par(mar=c(4,4,2,1))
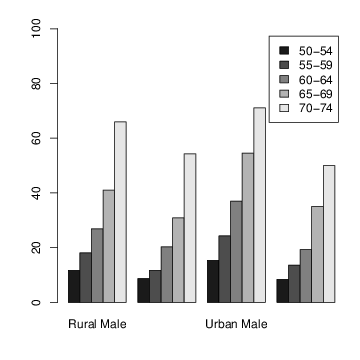
barplot(VADeaths, beside = TRUE,
# col = c("lightblue", "mistyrose", "lightcyan",
# "lavender", "cornsilk"),
col=gray(c(0.1,0.3,0.5,0.7,0.9)),
legend = rownames(VADeaths), ylim = c(0, 100))
#title(main = "Death Rates in Virginia", font.main = 4)
dev.off()