library(MASS)
attach(geyser)
pdf("geyser1.pdf",width=5,height=5)
par(mar=c(4,4,1,1))
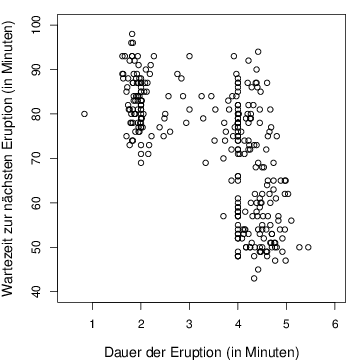
plot(duration,waiting,xlim = c(0.5,6), ylim = c(40,100),
xlab="Dauer der Eruption (in Minuten)",ylab="Wartezeit zur nächsten Eruption (in Minuten)",
cex.lab=1.2)
dev.off()
library(MASS)
attach(geyser)
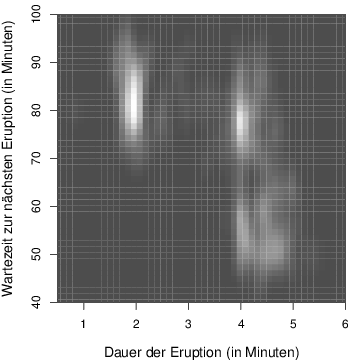
f2 <- kde2d(duration, waiting, n = 50, lims = c(0.5, 6, 40, 100),
h = c(width.SJ(duration), width.SJ(waiting)) )
pdf("geyser2.pdf",width=5,height=5)
par(mar=c(4,4,1,1))
image(f2, zlim = c(0, 0.05),col=gray(seq(0.3,1,by=0.01)),
xlim = c(0.5,6), ylim = c(40,100),
xlab="Dauer der Eruption (in Minuten)",ylab="Wartezeit zur nächsten Eruption (in Minuten)",
cex.lab=1.2)
dev.off()
library(MASS)
attach(geyser)
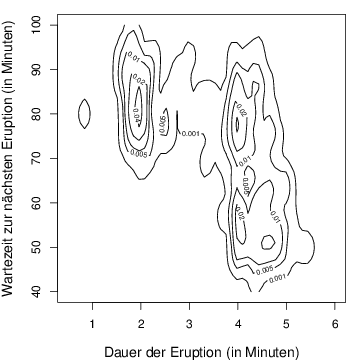
f2 <- kde2d(duration, waiting, n = 50, lims = c(0.5, 6, 40, 100),
h = c(width.SJ(duration), width.SJ(waiting)) )
pdf("geyser3.pdf",width=5,height=5)
par(mar=c(4,4,1,1))
contour(f2,levels = c(0.001, 0.005, 0.01, 0.02, 0.04),
xlim = c(0.5,6), ylim = c(40,100),
xlab="Dauer der Eruption (in Minuten)",ylab="Wartezeit zur nächsten Eruption (in Minuten)",
cex.lab=1.2)
dev.off()
library(MASS)
attach(geyser)
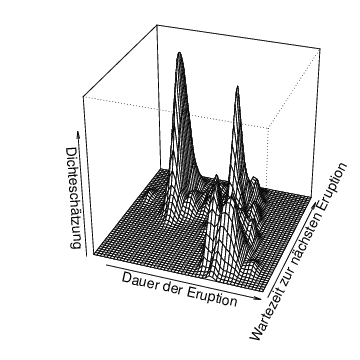
f2 <- kde2d(duration, waiting, n = 50, lims = c(0.5, 6, 40, 100),
h = c(width.SJ(duration), width.SJ(waiting)) )
pdf("geyser4.pdf",,width=5,height=5)
par(mar=c(4,4,1,1))
persp(f2, phi = 30, theta = 20, d = 5,
xlim = c(0.5,6), ylim = c(40,100),
xlab="Dauer der Eruption",ylab="Wartezeit zur nächsten Eruption",
zlab="Dichteschätzung",cex.lab=1.2)
dev.off()
# oder "Animation"
par(mar=c(4,4,1,1))
for (i in 1:180){
persp(f2, phi = i, theta = 20, d = 5,
xlim = c(0.5,6), ylim = c(40,100),
xlab="Dauer der Eruption",ylab="Wartezeit zur nächsten Eruption",
zlab="Dichteschätzung",cex.lab=1.2)
Sys.sleep(0.4)
}
detach("geyser")