
# Function for sunflowers
"sunfl" <- function(m,x,y,lx=1,ly=1,s=16,c=0.6){
#m ... frequency of observations
#x ... x-coordinate
#y ... y-coordinate
#l ... length of leaves of flower
#s ... plot symbol
#c ... cex for plot symbol
if (m==1) {points(x,y,pch=s,cex=c)}
if (m>1){
points(x,y,pch=s,cex=c)
# segments(x,y,x,y+l)
for (i in 1:m){
segments(x,y,x+lx*sin(i*2*pi/m),y+ly*cos(i*2*pi/m))
}
}
}
# Plot sunflower symbols for manuscript
pdf("sunfl1.pdf",width=1,height=1)
par(mar=c(0,0,0,0))
plot(0,0,xlim=c(-1,1),ylim=c(-1,1),type="n",xaxt="n",yaxt="n",frame.plot=F)
sunfl(1,0,0,lx=0.9,ly=0.9,c=0.8)
dev.off()

# Function for sunflowers
"sunfl" <- function(m,x,y,lx=1,ly=1,s=16,c=0.6){
#m ... frequency of observations
#x ... x-coordinate
#y ... y-coordinate
#l ... length of leaves of flower
#s ... plot symbol
#c ... cex for plot symbol
if (m==1) {points(x,y,pch=s,cex=c)}
if (m>1){
points(x,y,pch=s,cex=c)
# segments(x,y,x,y+l)
for (i in 1:m){
segments(x,y,x+lx*sin(i*2*pi/m),y+ly*cos(i*2*pi/m))
}
}
}
# Plot sunflower symbols for manuscript
pdf("sunfl2.pdf",width=1,height=1)
par(mar=c(0,0,0,0))
plot(0,0,xlim=c(-1,1),ylim=c(-1,1),type="n",xaxt="n",yaxt="n",frame.plot=F)
sunfl(2,0,0,lx=0.9,ly=0.9,c=0.8)
dev.off()

# Function for sunflowers
"sunfl" <- function(m,x,y,lx=1,ly=1,s=16,c=0.6){
#m ... frequency of observations
#x ... x-coordinate
#y ... y-coordinate
#l ... length of leaves of flower
#s ... plot symbol
#c ... cex for plot symbol
if (m==1) {points(x,y,pch=s,cex=c)}
if (m>1){
points(x,y,pch=s,cex=c)
# segments(x,y,x,y+l)
for (i in 1:m){
segments(x,y,x+lx*sin(i*2*pi/m),y+ly*cos(i*2*pi/m))
}
}
}
# Plot sunflower symbols for manuscript
pdf("sunfl3.pdf",width=1,height=1)
par(mar=c(0,0,0,0))
plot(0,0,xlim=c(-1,1),ylim=c(-1,1),type="n",xaxt="n",yaxt="n",frame.plot=F)
sunfl(3,0,0,lx=0.9,ly=0.9,c=0.8)
dev.off()

# Function for sunflowers
"sunfl" <- function(m,x,y,lx=1,ly=1,s=16,c=0.6){
#m ... frequency of observations
#x ... x-coordinate
#y ... y-coordinate
#l ... length of leaves of flower
#s ... plot symbol
#c ... cex for plot symbol
if (m==1) {points(x,y,pch=s,cex=c)}
if (m>1){
points(x,y,pch=s,cex=c)
# segments(x,y,x,y+l)
for (i in 1:m){
segments(x,y,x+lx*sin(i*2*pi/m),y+ly*cos(i*2*pi/m))
}
}
}
# Plot sunflower symbols for manuscript
pdf("sunfl4.pdf",width=1,height=1)
par(mar=c(0,0,0,0))
plot(0,0,xlim=c(-1,1),ylim=c(-1,1),type="n",xaxt="n",yaxt="n",frame.plot=F)
sunfl(4,0,0,lx=0.9,ly=0.9,c=0.8)
dev.off()

# Function for sunflowers
"sunfl" <- function(m,x,y,lx=1,ly=1,s=16,c=0.6){
#m ... frequency of observations
#x ... x-coordinate
#y ... y-coordinate
#l ... length of leaves of flower
#s ... plot symbol
#c ... cex for plot symbol
if (m==1) {points(x,y,pch=s,cex=c)}
if (m>1){
points(x,y,pch=s,cex=c)
# segments(x,y,x,y+l)
for (i in 1:m){
segments(x,y,x+lx*sin(i*2*pi/m),y+ly*cos(i*2*pi/m))
}
}
}
# Plot sunflower symbols for manuscript
pdf("sunfl5.pdf",width=1,height=1)
par(mar=c(0,0,0,0))
plot(0,0,xlim=c(-1,1),ylim=c(-1,1),type="n",xaxt="n",yaxt="n",frame.plot=F)
sunfl(5,0,0,lx=0.9,ly=0.9,c=0.8)
dev.off()
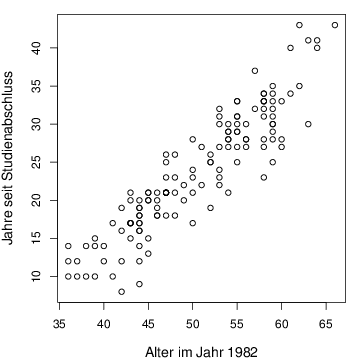
studa <- read.csv( " studienabschl.csv " )
pdf("scatter2d.pdf",width=5,height=5)
par(mar=c(4,4,1,1))
plot(studa,xlab="Alter im Jahr 1982",ylab="Jahre seit Studienabschluss",
cex.lab=1.2)
dev.off()
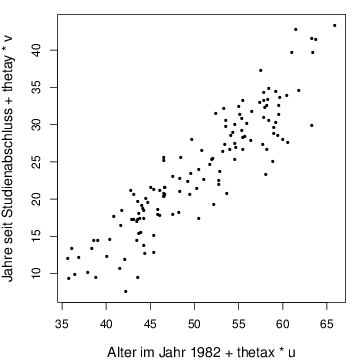
studa <- read.csv( " studienabschl.csv " )
# Jittering
x <- studa[,1]
y <- studa[,2]
thetax <- 0.02*(max(x)-min(x))
thetay <- 0.02*(max(y)-min(y))
n <- nrow(studa)
u <- -1+seq(from=0,by=2/(n-1),length=n)
v <- -1+seq(from=0,by=2/(n-1),length=n)
set.seed(100)
xt <- x+thetax*sample(u,n)
yt <- y+thetay*sample(v,n)
pdf("scatter2dj.pdf",width=5,height=5)
par(mar=c(4,4,1,1))
plot(xt,yt,xlab="Alter im Jahr 1982 + thetax * u",
ylab="Jahre seit Studienabschluss + thetay * v",
cex.lab=1.2,pch=16,cex=0.6)
dev.off()
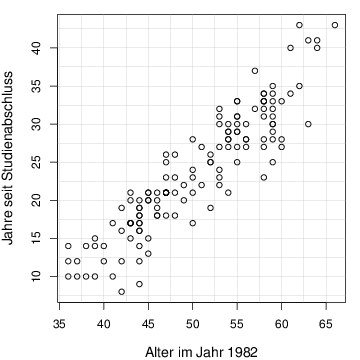
studa <- read.csv( " studienabschl.csv " )
x <- studa[,1]
y <- studa[,2]
xsep <- seq(35,by=2.5,to=70)
ysep <- seq(5,by=2.5,to=45)
nx <- length(xsep)-1
ny <- length(ysep)-1
# original data with grid
pdf("scatter2dsuno.pdf",width=5,height=5)
par(mar=c(4,4,1,1))
plot(studa,xlab="Alter im Jahr 1982",ylab="Jahre seit Studienabschluss",
cex.lab=1.2,type="n")
abline(h=ysep,lty=1,lwd=0.3,col=gray(0.7))
abline(v=xsep,lty=1,lwd=0.3,col=gray(0.7))
points(studa)
dev.off()
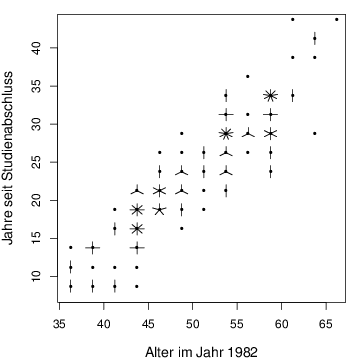
studa <- read.csv( " studienabschl.csv " )
x <- studa[,1]
y <- studa[,2]
xsep <- seq(35,by=2.5,to=70)
ysep <- seq(5,by=2.5,to=45)
nx <- length(xsep)-1
ny <- length(ysep)-1
# Sunflower plot
xsep <- seq(35,by=2.5,to=70)
ysep <- seq(5,by=2.5,to=45)
nx <- length(xsep)-1
ny <- length(ysep)-1
anz <- matrix(NA,nx,ny)
for (i in 1:nx){
xsel <- ((x>xsep[i]) & (x<=xsep[i+1]))
for (j in 1:ny){
ysel <- ((y[xsel]>ysep[j]) & (y[xsel]<=ysep[j+1]))
anz[i,j] <- sum(ysel)
}
}
pdf("scatter2dsun.pdf",width=5,height=5)
par(mar=c(4,4,1,1))
plot(studa,xlab="Alter im Jahr 1982",ylab="Jahre seit Studienabschluss",
cex.lab=1.2,type="n")
for (i in 1:nx){
for (j in 1:ny){
sunfl(anz[i,j],(xsep[i]+xsep[i+1])/2,(ysep[j]+ysep[j+1])/2,lx=0.8,ly=0.8)
}
}
dev.off()
# Function for sunflowers
"sunfl" <- function(m,x,y,lx=1,ly=1,s=16,c=0.6){
#m ... frequency of observations
#x ... x-coordinate
#y ... y-coordinate
#l ... length of leaves of flower
#s ... plot symbol
#c ... cex for plot symbol
if (m==1) {points(x,y,pch=s,cex=c)}
if (m>1){
points(x,y,pch=s,cex=c)
# segments(x,y,x,y+l)
for (i in 1:m){
segments(x,y,x+lx*sin(i*2*pi/m),y+ly*cos(i*2*pi/m))
}
}
}
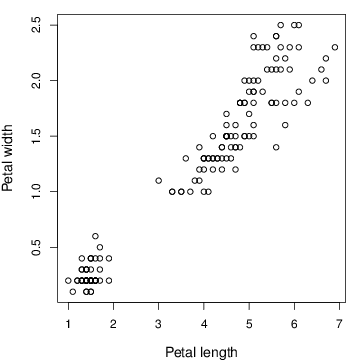
data(iris)
x <- iris[,3]
y <- iris[,4]
# Plot original data
pdf("scatter2dsun1.pdf",width=5,height=5)
par(mar=c(4,4,1,1))
plot(iris[,3:4],xlab="Petal length",ylab="Petal width",
cex.lab=1.2)
dev.off()
"sunfl" <- function(m,x,y,lx=1,ly=1,s=16,c=0.6){
#m ... frequency of observations
#x ... x-coordinate
#y ... y-coordinate
#l ... length of leaves of flower
#s ... plot symbol
#c ... cex for plot symbol
if (m==1) {points(x,y,pch=s,cex=c)}
if (m>1){
points(x,y,pch=s,cex=c)
# segments(x,y,x,y+l)
for (i in 1:m){
segments(x,y,x+lx*sin(i*2*pi/m),y+ly*cos(i*2*pi/m))
}
}
}
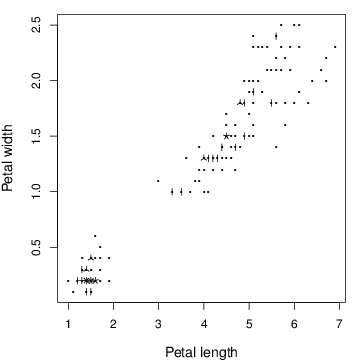
# Iris Daten:
data(iris)
x <- iris[,3]
y <- iris[,4]
# Sunflower plot:
xsame <- as.numeric(levels(factor(sort(x))))
ysame <- as.numeric(levels(factor(sort(y))))
pdf("scatter2dsun2.pdf",width=5,height=5)
par(mar=c(4,4,1,1))
plot(iris[,3:4],xlab="Petal length",ylab="Petal width",
cex.lab=1.2,type="n")
for (i in 1:length(xsame)){
for (j in 1:length(ysame)){
sunfl(sum(apply(iris[,3:4]==rep(1,150)%*%t(c(xsame[i],ysame[j])),1,sum)==2),
xsame[i],ysame[j],lx=0.07,ly=0.03,c=0.4)
}
}
dev.off()