# Buffalo Snowfall Daten
data(buffalo,package="gss")
dat <- buffalo
library(StatDA)
data(ohorizon)
As=ohorizon$As
pdf("edaplots.pdf",width=9,height=4.5)
par(mfrow=c(1,2))
par(mar=c(4.3,4.3,2,2))
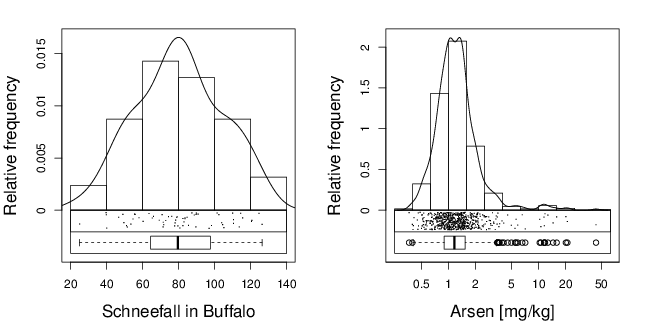
edaplot(dat,H.freq=FALSE,P.main="",P.xlab="Schneefall in Buffalo")
edaplotlog(log10(As),H.freq=FALSE,P.log=TRUE,P.main="",P.xlab="Arsen [mg/kg]")
dev.off()
data(Traffic,package="MASS")
pdf("boxplots2.pdf",width=3,height=3)
par(mar=c(2,4,1,1))
par(las=0)
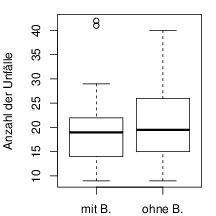
boxplot(Traffic[23:44,4],Traffic[1:22,4],names=c("mit B.","ohne B."),
ylab="Anzahl der Unf‰lle")
dev.off()
load("~/projekte/OLD/holawe/splus/.RData")
years <- 1971:1990
days <- c(365,366,365,365,365,366,365,365,365,366,365,365,365,366,365,365,365,366,365,365)
days0 <- c(0,days)
numbyear <- matrix(NA,nrow=ncol(holawe),ncol=length(years))
for (i in 1:length(years)){
numbyear[,i] <- apply(holawe[(1+sum(days0[1:i])):(sum(days[1:i])),],2,sum)
}
pdf("boxplots.pdf",width=7,height=4)
par(mar=c(3,4,1,1))
par(las=3)
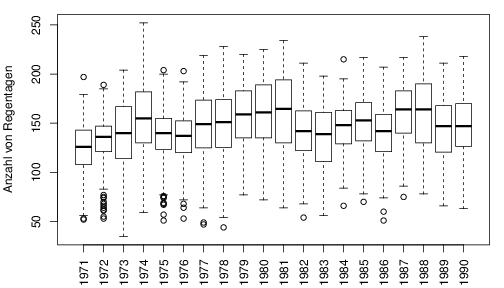
boxplot(as.data.frame(numbyear),names=years,ylab="Anzahl von Regentagen")
dev.off()
data(Traffic,package="MASS")
pdf("boxplots2n.pdf",width=3,height=3)
par(mar=c(2,4,1,1))
par(las=0)
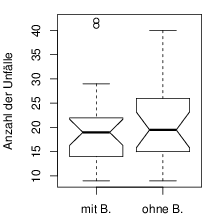
boxplot(Traffic[23:44,4],Traffic[1:22,4],names=c("mit B.","ohne B."),
ylab="Anzahl der Unf‰lle",notch=TRUE)
dev.off()