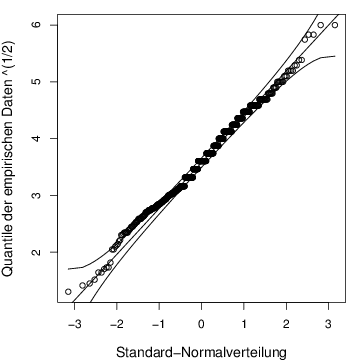
data(chorizon,package="StatDA")
dat <- chorizon$Sc_INAA
x <- dat^(1/2)
n <- length(x)
emp <- (seq(1,n)-0.5)/n
the <- qnorm(ppoints(n))
xq <- quantile(x,c(0.25,0.75))
theq <- qnorm(c(0.25,0.75))
delta <- diff(xq)/diff(theq)
int <- xq[1] - delta * theq[1]
xstd <- (x-median(x))/xq*1.349
sdev <- delta/dnorm(the)*sqrt(emp*(1-emp)/n)
pdf("quanstreu1.pdf",width=5,height=5)
par(mar=c(4,4,1,1))
plot(the,sort(x),xlab="Standard-Normalverteilung",
ylab="Quantile der empirischen Daten ^(1/2)",cex.lab=1.2)
abline(int,delta)
lines(the,(int+delta*the)+2*sdev,lty=1)
lines(the,(int+delta*the)-2*sdev,lty=1)
dev.off()
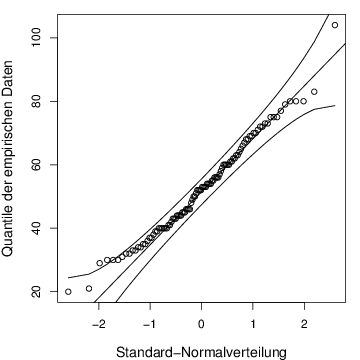
data("Rainfall",package="bootstrap")
x <- Rainfall
n <- length(x)
emp <- (seq(1,n)-0.5)/n
the <- qnorm(ppoints(n))
xq <- quantile(x,c(0.25,0.75))
theq <- qnorm(c(0.25,0.75))
delta <- diff(xq)/diff(theq)
int <- xq[1] - delta * theq[1]
xstd <- (x-median(x))/xq*1.349
sdev <- delta/dnorm(the)*sqrt(emp*(1-emp)/n)
pdf("quanstreu2.pdf",width=5,height=5)
par(mar=c(4,4,1,1))
plot(the,sort(x),xlab="Standard-Normalverteilung",
ylab="Quantile der empirischen Daten",cex.lab=1.2)
abline(int,delta)
lines(the,(int+delta*the)+2*sdev,lty=1)
lines(the,(int+delta*the)-2*sdev,lty=1)
dev.off()