pdf("boxcar.pdf",width=2,height=2)
par(mar=c(0,0,0,0))
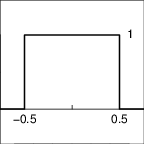
x <- c(-1,-0.5,-0.5,0.5,0.5,1)
y <- c(0,0,1,1,0,0)
plot(x,y,xlab="",ylab="",xlim=c(-0.7,0.7),ylim=c(-0.4,1.4),type="l",lwd=2)
abline(c(0,0))
text(-0.5,0,"-0.5",pos=1)
text(0.5,0,"0.5",pos=1)
text(0.5,1,"1",pos=4)
segments(0,0,0,0.05)
dev.off()
pdf("cosinus.pdf",width=2,height=2)
par(mar=c(0,0,0,0))
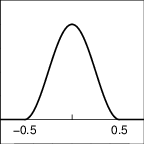
x1 <- seq(from=-0.5,to=0.5,length=1000)
y1 <- 1+cos(2*pi*x1)
x <- c(-1,x1,1)
y <- c(0,y1,0)
plot(x,y,xlab="",ylab="",xlim=c(-0.7,0.7),ylim=c(-0.4,2.4),type="l",lwd=2)
abline(c(0,0))
text(-0.5,0,"-0.5",pos=1)
text(0.5,0,"0.5",pos=1)
segments(0,0,0,0.1)
dev.off()
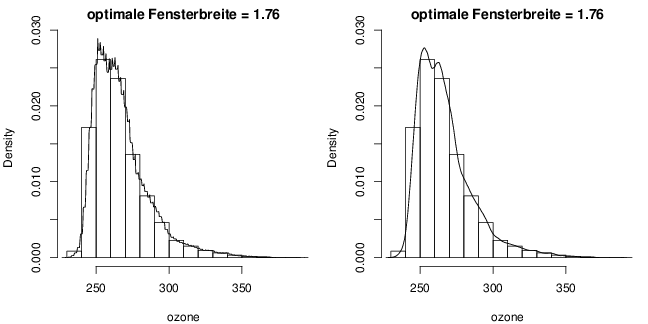
data(ozone,package="plyr")
# For rectangular kernel:
# Density plot
pdf("density1.pdf",width=9,height=4.5)
par(mfrow=c(1,2))
par(mar=c(4,4,2,1))
dens <- density(ozone,kernel="rectangular")
hist(ozone,freq=FALSE,ylim=c(0,0.029),
main=paste("optimale Fensterbreite =",round(dens$bw,2)))
lines(dens)
dens <- density(ozone,kernel="cosine")
hist(ozone,freq=FALSE,ylim=c(0,0.029),
main=paste("optimale Fensterbreite =",round(dens$bw,2)))
lines(dens)
dev.off()