data(ozone,package="plyr")
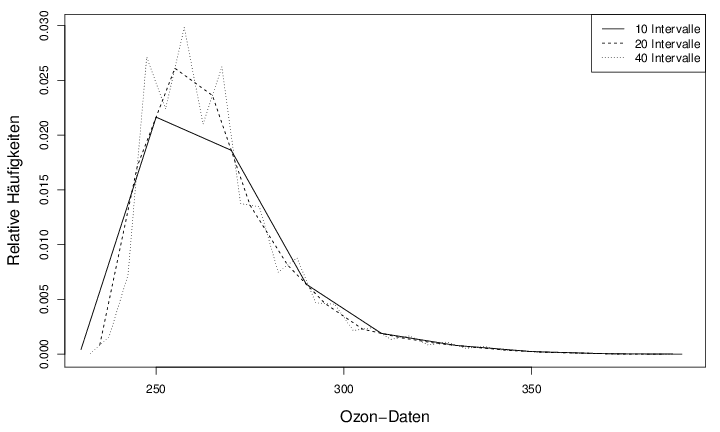
af1 <- hist(ozone,10)
af2 <- hist(ozone,20)
af3 <- hist(ozone,40)
# plot
pdf("freqpol.pdf",width=10,height=6)
par(mar=c(4.5,4.5,1,1))
plot(0,0,xlim=range(ozone),ylim=c(0,max(af1$d,af2$d,af3$d)),type="n",
xlab="Ozon-Daten",ylab="Relative Häufigkeiten",cex.lab=1.3)
lines(af1$mids,af1$dens,lty=1)
lines(af2$mids,af2$dens,lty=2)
lines(af3$mids,af3$dens,lty=3)
legend("topright",legend=c("10 Intervalle","20 Intervalle","40 Intervalle"),
lty=c(1,2,3))
dev.off()