library(StatDA)
data(chorizon)
Ba=chorizon[,"Ba"]
pdf("fig-19-1.pdf",width=9,height=4.5)
par(mfrow=c(1,2))
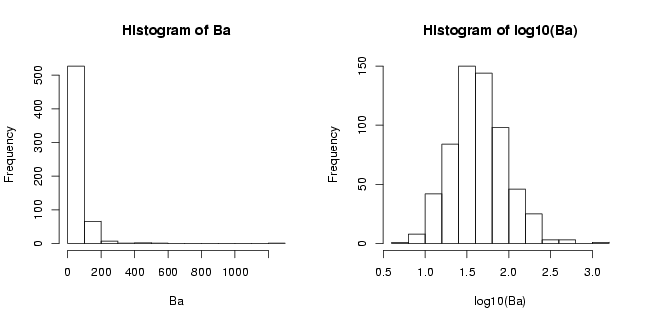
hist(Ba)
hist(log10(Ba))
dev.off()

|
# Figure 19.1.: histogram of Ba and log10(Ba) in C-horizon
library(StatDA) data(chorizon) Ba=chorizon[,"Ba"] pdf("fig-19-1.pdf",width=9,height=4.5) par(mfrow=c(1,2)) hist(Ba) hist(log10(Ba)) dev.off() |