library(StatDA)
# Field duplicates
data(CHorFieldDUP)
xd1=CHorFieldDUP[,5:98]
xd2=CHorFieldDUP[,99:192]
pdf("fig-18-3.pdf",width=9,height=4.5)
par(mfrow=c(1,2),mar=c(4,4,2,2))
i=39
xmean=apply(cbind(xd1[,i],xd2[,i]),1,mean)
xdiff=abs(xd1[,i]-xd2[,i])
xmax=max(xmean)
ymax=max(xdiff)
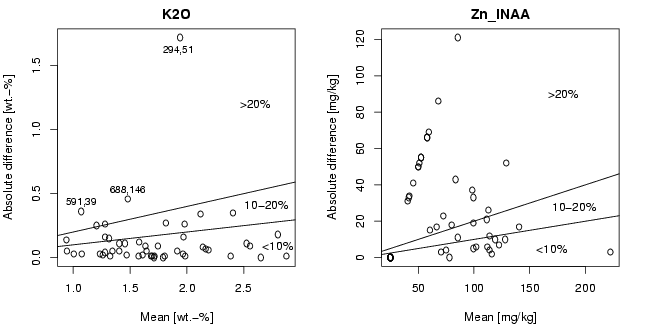
plot(xmean,xdiff,main="K2O",xlab="Mean [wt.-%]",ylab="Absolute difference [wt.-%]",
ylim=c(0,ymax))
abline(a=0,b=0.1)
abline(a=0,b=0.2)
text(2.8,0.09,"<10%")
text(2.7,0.41,"10-20%")
text(2.6,1.2,">20%")
# label observations
text(1.07,0.43,"591,39",cex=0.85)
text(1.92,1.62,"294,51",cex=0.85)
text(1.48,0.53,"688,146",cex=0.85)
i=94
xmean=apply(cbind(xd1[,i],xd2[,i]),1,mean)
xdiff=abs(xd1[,i]-xd2[,i])
xmax=max(xmean)
ymax=max(xdiff)
plot(xmean,xdiff,main="Zn_INAA",xlab="Mean [mg/kg]",ylab="Absolute difference [mg/kg]",
ylim=c(0,ymax))
abline(a=0,b=0.1)
abline(a=0,b=0.2)
text(170,5,"<10%")
text(190,28,"10-20%")
text(180,90,">20%")
dev.off()