library(StatDA)
data(chorizon)
data(kola.background)
var=c("Si_XRF","Al_XRF","K_XRF","LOI","P","Mn")
ri=c(-2.0,1.5,2.0,2.0,3.0,2.0)
x=chorizon[,var]
res=rg.wtdsums(x,ri)
ws=res$ws
wss=(ws-min(ws))/(max(ws)-min(ws))
lit=chorizon[,"LITO"]
Region=rep(1, length(lit))
Region[lit==82] <- 3
Region[lit==83] <- 3
X=chorizon[,"XCOO"]
Y=chorizon[,"YCOO"]
XY=cbind(X,Y)
# true representation of x and y axis of map for plot
xwid=diff(range(X))/12e4
ywid=diff(range(Y))/12e4
pdf("fig-17-7.pdf",width=2*xwid,height=1*ywid)
par(mfrow=c(1,2),mar=c(1.5,1.5,1.5,1.5))
plot(X,Y,frame.plot=FALSE,xaxt="n",yaxt="n",xlab="",ylab="",type="n")
plotbg(map.col=c("gray","gray","gray","gray"),add.plot=T)
points(XY[Region==3,],pch=17,cex=0.8)
points(XY[Region==1,],pch=3,cex=0.8)
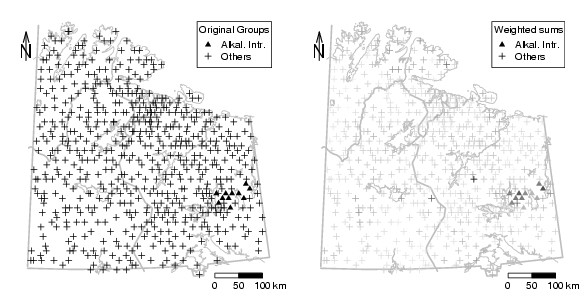
legend("topright",pch=c(17,3),pt.cex=c(0.8,0.8), legend=c("Alkal. Intr.",
"Others"), cex=0.8,title="Original Groups")
# scalebar
scalebar(761309,7373050,861309,7363050,shifttext=-0.5,shiftkm=37e3,sizetext=0.8)
# North arrow
Northarrow(362602,7818750,362602,7878750,362602,7838750,Alength=0.15,Aangle=15,Alwd=1.3,Tcex=1.6)
#######################################################################################
# Results Group 1
# generate plot with background
plot(X,Y,frame.plot=FALSE,xaxt="n",yaxt="n",xlab="",ylab="",type="n")
plotbg(map.col=c("gray","gray","gray","gray"),add.plot=T)
points(XY[Region==3,],pch=17,cex=0.8,col=gray(1-wss[Region==3]))
points(XY[Region==1,],pch=3,cex=0.8,col=gray(1-wss[Region==1]))
legend("topright",pch=c(17,3),pt.cex=c(0.8,0.8),
legend=c("Alkal. Intr.","Others"),
cex=0.8,title="Weighted sums")
# scalebar
scalebar(761309,7373050,861309,7363050,shifttext=-0.5,shiftkm=37e3,sizetext=0.8)
# North arrow
Northarrow(362602,7818750,362602,7878750,362602,7838750,Alength=0.15,Aangle=15,Alwd=1.3,Tcex=1.6)
dev.off()