library(StatDA)
data(chorizon)
data(kola.background)
attach(chorizon)
X=chorizon[,"XCOO"]
Y=chorizon[,"YCOO"]
#######################################################################################
# Explanatory variables: log-ratio against Ti_XRF
xdat=log10(chorizon[,101:109]/chorizon[,110])
set.seed(101)
xdat.mcd=covMcd(xdat,cor=T)
md=sqrt(xdat.mcd$mah)
crit=sqrt(qchisq(0.975,ncol(xdat)))
#######################################################################################
# Response variable: Be
# robust
set.seed(104)
res=ltsReg(log10(Be) ~ Al_XRF+Ca_XRF+Fe_XRF+K_XRF+Mg_XRF+Mn_XRF+Na_XRF+P_XRF+Si_XRF,
data=xdat)
resid=res$residuals/res$scale
#######################################################################################
# true representation of x and y axis of map for plot
xwid=diff(range(X))/12e4
ywid=diff(range(Y))/12e4
pdf("fig-16-9.pdf",width=2*xwid,height=2*ywid)
par(mfrow=c(2,2),mar=c(4,4,2,2))
#######################################################################################
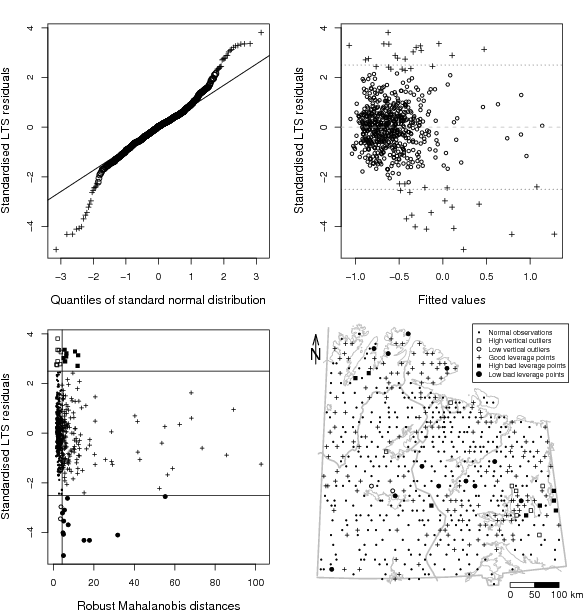
# QQ-plot
psymb=res$lts.wt
psymb[res$lts.wt==1] <- 1
psymb[res$lts.wt==0] <- 3
pcex=res$lts.wt
pcex[res$lts.wt==1] <- 1.3
pcex[res$lts.wt==0] <- 0.8
qqnorm(resid,xlab="Quantiles of standard normal distribution",ylab="Standardised LTS residuals",
pch=psymb,cex=pcex,main="",cex.lab=1.2)
qqline(resid)
#######################################################################################
# Residuals versus Fitted
plot(res$fitted,resid,cex.lab=1.2,xlab="Fitted values",ylab="Standardised LTS residuals",type="n")
points(res$fitted[res$lts.wt==0],resid[res$lts.wt==0],cex=0.8,pch=3)
points(res$fitted[res$lts.wt==1],resid[res$lts.wt==1],cex=0.8,pch=1)
abline(h=0,col="grey",lty=2)
abline(h=c(-2.5,2.5),lty=3,cex=1.1)
#######################################################################################
# Robust diagnostics plot
symb.nor=16
symb.resl=1
symb.resh=22
symb.goodl=3
symb.badll=16
symb.badlh=15
plot(md,resid,cex=0.5,pch=3,type="n",xlab="Robust Mahalanobis distances",
ylab="Standardised LTS residuals", cex.lab=1.2)
abline(h=c(2.5,-2.5))
abline(v=crit)
md.resid=as.data.frame(cbind(md,resid))
points(md.resid[md<crit & abs(resid)<2.5,], cex=0.3,pch=symb.nor)
points(md.resid[md<crit & resid>=2.5,], cex=0.9,pch=symb.resh)
points(md.resid[md<crit & resid<=(-2.5),], cex=0.9,pch=symb.resl)
points(md.resid[md>=crit & abs(resid)<2.5,], cex=0.6,pch=symb.goodl)
points(md.resid[md>=crit & resid>=2.5,], cex=0.9,pch=symb.badlh)
points(md.resid[md>=crit & resid<=(-2.5),], cex=0.9,pch=symb.badll)
#######################################################################################
# Map for diagnostics
par(mar=c(1.5,1.5,1.5,1.5))
XY=cbind(X,Y)
# plot outliers in map
plot(X,Y,frame.plot=FALSE,xaxt="n",yaxt="n",xlab="",ylab="",type="n")
plotbg(map.col=c("gray","gray","gray","gray"),add.plot=T)
points(XY[md<crit & abs(resid)<2.5,], cex=0.3,pch=symb.nor)
points(XY[md<crit & resid>=2.5,], cex=0.9,pch=symb.resh)
points(XY[md<crit & resid<=(-2.5),], cex=0.9,pch=symb.resl)
points(XY[md>=crit & abs(resid)<2.5,], cex=0.6,pch=symb.goodl)
points(XY[md>=crit & resid>=2.5,], cex=0.9,pch=symb.badlh)
points(XY[md>=crit & resid<=(-2.5),], cex=0.9,pch=symb.badll)
legend("topright",pch=c(symb.nor,symb.resh,symb.resl,symb.goodl,symb.badlh,symb.badll),
pt.cex=c(0.3,0.9,0.9,0.6,0.9,1.1),
legend=c("Normal observations","High vertical outliers","Low vertical outliers",
"Good leverage points","High bad leverage points","Low bad leverage points"), cex=0.7)
# scalebar
scalebar(761309,7373050,861309,7363050,shifttext=-0.5,shiftkm=37e3,sizetext=0.8)
# North arrow
Northarrow(362602,7818750,362602,7878750,362602,7838750,Alength=0.15,Aangle=15,Alwd=1.3,Tcex=1.6)
#######################################################################################
dev.off()