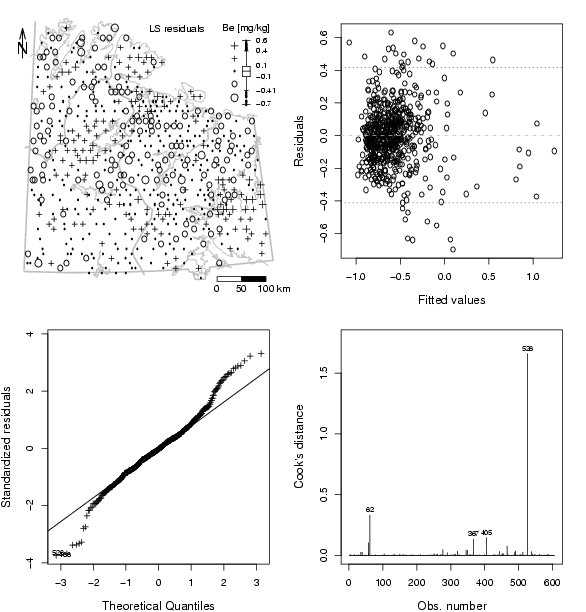
library(StatDA)
data(chorizon)
data(kola.background)
attach(chorizon)
X=chorizon[,"XCOO"]
Y=chorizon[,"YCOO"]
#######################################################################################
# Explanatory variables: log-ratio against Ti_XRF
xdat=log10(chorizon[,101:109]/chorizon[,110])
#######################################################################################
# Response variable: Be
# classical
#res=lm(log10(Be) ~ Al2O3+CaO+Fe2O3+K2O+MgO+MnO+Na2O+P2O5+SiO2+TiO2)
#resold=lm(log10(Be) ~ Al_XRF+Ca_XRF+Fe_XRF+K_XRF+Mg_XRF+Mn_XRF+Na_XRF+P_XRF+Si_XRF+Ti_XRF)
res=lm(log10(Be) ~ Al_XRF+Ca_XRF+Fe_XRF+K_XRF+Mg_XRF+Mn_XRF+Na_XRF+P_XRF+Si_XRF, data=xdat)
#######################################################################################
# plot with map:
# true representation of x and y axis of map for plot
xwid=diff(range(X))/12e4
ywid=diff(range(Y))/12e4
pdf("fig-16-8.pdf",width=2*xwid,height=2*ywid)
par(mfrow=c(2,2),mar=c(1.5,1.5,1.5,1.5))
### NEW MAP:
dat=res$resid
# generate plot with packground
plot(X,Y,frame.plot=FALSE,xaxt="n",yaxt="n",xlab="",ylab="",type="n")
plotbg(map.col=c("gray","gray","gray","gray"),add.plot=T)
SymbLegend(X,Y,dat,type="boxplot",qutiles<-c(0,0.05,0.25,0.75,0.95,1),symbtype="EDA",symbmagn=0.8,
leg.position="topright",leg.title="Be [mg/kg]",leg.title.cex=1.0,leg.round=2,leg.wid=4,
leg.just="right",cex.scale=0.8,xf=8e3,logscale=FALSE,accentuate=FALSE)
# Class legend
text(min(X)+diff(range(X))*5/8,max(Y),"LS residuals",cex=1.0)
# scalebar
scalebar(761309,7373050,861309,7363050,shifttext=-0.5,shiftkm=37e3,sizetext=0.8)
# North arrow
Northarrow(362602,7818750,362602,7878750,362602,7838750,Alength=0.15,Aangle=15,Alwd=1.3,Tcex=1.6)
#####################################################################################
par(mar=c(4,4,2,2))
plot(res$fitted,res$resid,cex.lab=1.2,xlab="Fitted values",ylab="Residuals")
abline(h=0,col="grey",lty=2)
boxinfo=boxplot(dat,plot=F)
abline(h=boxinfo$stats[c(1,5)],lty=3,cex=1.1)
#####################################################################################
plot.lm(res,which=2,caption="",sub.caption="",id.n=2,cex.lab=1.2,pch=3,cex=0.9)
qqline(residuals(res)/sd(residuals(res)),datax=FALSE,lwd=1)
plot.lm(res,which=4,caption="",sub.caption="",id.n=4,cex.lab=1.2)
dev.off()
lm(formula = log10(Be) ~ Al_XRF + Ca_XRF + Fe_XRF + K_XRF + Mg_XRF + Mn_XRF + Na_XRF + P_XRF + Si_XRF, data = xdat)
Residuals:
Min 1Q Median 3Q Max
-0.697371 -0.117505 -0.004728 0.096237 0.630604
Coefficients:
Estimate Std. Error t value Pr(>|t|)
(Intercept) 4.847e+00 4.925e-01 9.842 < 2e-16 ***
Al_XRF -1.139e-05 1.512e-06 -7.536 1.81e-13 ***
Ca_XRF -1.594e-05 2.002e-06 -7.961 8.67e-15 ***
Fe_XRF -5.967e-06 1.346e-06 -4.434 1.10e-05 ***
K_XRF 1.481e-05 2.284e-06 6.485 1.87e-10 ***
Mg_XRF -6.034e-06 2.505e-06 -2.409 0.0163 *
Mn_XRF 2.233e-04 3.925e-05 5.688 2.02e-08 ***
Na_XRF -1.389e-07 2.122e-06 -0.065 0.9478
P_XRF -3.856e-05 3.080e-05 -1.252 0.2111
Si_XRF -1.367e-05 1.045e-06 -13.087 < 2e-16 ***
---
Signif. codes: 0 '***' 0.001 '**' 0.01 '*' 0.05 '.' 0.1 ' ' 1
Residual standard error: 0.1914 on 595 degrees of freedom
Multiple R-Squared: 0.6904, Adjusted R-squared: 0.6857
F-statistic: 147.4 on 9 and 595 DF, p-value: < 2.2e-16
library(StatDA)
data(chorizon)
data(kola.background)
attach(chorizon)
X=chorizon[,"XCOO"]
Y=chorizon[,"YCOO"]
#######################################################################################
# Explanatory variables: log-ratio against Ti_XRF
xdat=log10(chorizon[,101:109]/chorizon[,110])
#######################################################################################
# Response variable: Be
# classical
#resold=lm(log10(Be) ~ Al_XRF+Ca_XRF+Fe_XRF+K_XRF+Mg_XRF+Mn_XRF+Na_XRF+P_XRF+Si_XRF+Ti_XRF)
res=lm(log10(Be) ~ Al_XRF+Ca_XRF+Fe_XRF+K_XRF+Mg_XRF+Mn_XRF+Na_XRF+P_XRF+Si_XRF, data=xdat)
sink("tab-16-2.txt")
print(summary(res))
sink()