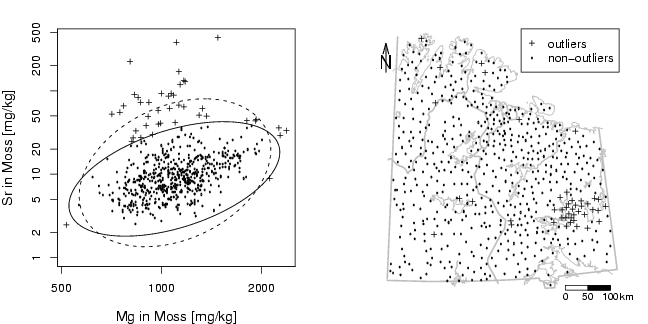
library(StatDA)
data(moss)
Mg=log10(moss[,"Mg"])
Sr=log10(moss[,"Sr"])
x=cbind(Mg,Sr)
x.mcd=covMcd(x)
pdf("fig-13-3.pdf",width=9,height=4.5)
par(mfcol=c(1,2),mar=c(4,4,2,2))
plot(Mg,Sr,xlab="Mg in Moss [mg/kg]",ylab="Sr in Moss [mg/kg]",
cex.lab=1.2, cex=0.7, pch=3, xaxt="n", yaxt="n",
ylim=c(0,max(Sr)),type="n")
axis(1,at=log10(alog<-sort(c((10^(-50:50))%*%t(c(2,5,10))))),labels=alog)
axis(2,at=log10(alog<-sort(c((10^(-50:50))%*%t(c(2,5,10))))),labels=alog)
outl=(mahalanobis(x,x.mcd$cent,x.mcd$cov) > qchisq(0.98,2))
points(Mg[outl], Sr[outl],pch=3,cex=0.7)
points(Mg[!outl], Sr[!outl],pch=21,cex=0.2)
x=cbind(Mg,Sr)
plotellipse(apply(x,2,mean),cov(x),perc=c(0.98),lty=2)
x.mcd=covMcd(x)
plotellipse(x.mcd$cent,x.mcd$cov,perc=c(0.98))
par(mar=c(2,4,2,2))
X=moss[,"XCOO"]
Y=moss[,"YCOO"]
data(kola.background)
# generate plot with background
plot(X,Y,frame.plot=FALSE,xaxt="n",yaxt="n",xlab="",ylab="",type="n")
plotbg(map.col=c("gray","gray","gray","gray"),add.plot=T)
legend("topright",pch=c(3,21),pt.cex=c(0.7,0.2), legend=c("outliers",
"non-outliers"), cex=1)
points(X[outl],Y[outl],pch=3,cex=0.7)
points(X[!outl],Y[!outl],pch=21,cex=0.2)
# scalebar
scalebar(761309,7373050,861309,7363050,shifttext=-0.5,shiftkm=37e3,sizetext=0.8)
# North arrow
Northarrow(362602,7818750,362602,7878750,362602,7838750,Alength=0.15,Aangle=15,Alwd=1.3,Tcex=1.6)
dev.off()