library(StatDA)
data(ohorizon)
X=ohorizon[,"XCOO"]
Y=ohorizon[,"YCOO"]
el=log10(ohorizon[,c("Co","Cu","Ni","Rb","Bi","Na","Sr")])
data(kola.background)
sel <- c(3,8,22, 29, 32, 35, 43, 69, 73 ,93,109,129,130,134,168,181,183,205,211,
218,237,242,276,292,297,298,345,346,352,372,373,386,408,419,427,441,446,490,
516,535,551,556,558,564,577,584,601,612,617)
x=el[sel,]
dimnames(x)[[1]]=ohorizon[sel,1]
# true representation of x and y axis of map for plot
xwid=diff(range(X))/12e4
ywid=diff(range(Y))/12e4
pdf("fig-12-7.pdf",width=2*xwid,height=1*ywid)
par(mfrow=c(1,2),mar=c(1.5,1.5,1.5,1.5))
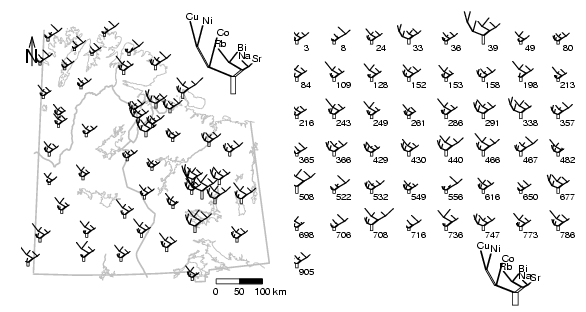
plot(X,Y,frame.plot=FALSE,xaxt="n",yaxt="n",xlab="",ylab="",type="n",
xlim=c(360000,max(X)))
plotbg(map.col=c("gray","gray","gray","gray"),add.plot=T)
tree(x,locations=cbind(X[sel],Y[sel]),len=700,key.loc=c(793000,7760000),leglen=1500,
cex=0.75, add=T, leglh=6,lh=30,wmax=120,wmin=30,labels=NULL)
# scalebar
scalebar(761309,7373050,861309,7363050,shifttext=-0.5,shiftkm=37e3,sizetext=0.8)
# North arrow
Northarrow(362602,7818750,362602,7878750,362602,7838750,Alength=0.15,Aangle=15,Alwd=1.3,Tcex=1.6)
par(mar=c(.1,.1,.1,.5))
tree(x,key.loc=c(15,0),len=0.022, lh=30,leglh=4,
wmax=120,wmin=30, leglen=0.05, ncol=8, cex=0.75)
dev.off()
library(StatDA)
data(ohorizon)
X=ohorizon[,"XCOO"]
Y=ohorizon[,"YCOO"]
el=log10(ohorizon[,c("Co","Cu","Ni","Rb","Bi","Na","Sr")])
data(kola.background)
sel <- c(3,8,22, 29, 32, 35, 43, 69, 73 ,93,109,129,130,134,168,181,183,205,211,
218,237,242,276,292,297,298,345,346,352,372,373,386,408,419,427,441,446,490,
516,535,551,556,558,564,577,584,601,612,617)
x=el[sel,]
dimnames(x)[[1]]=ohorizon[sel,1]
# true representation of x and y axis of map for plot
xwid=diff(range(X))/12e4
ywid=diff(range(Y))/12e4
pdf("fig-12-8.pdf",width=2*xwid,height=1*ywid)
par(mfrow=c(1,2),mar=c(1.5,1.5,1.5,1.5))
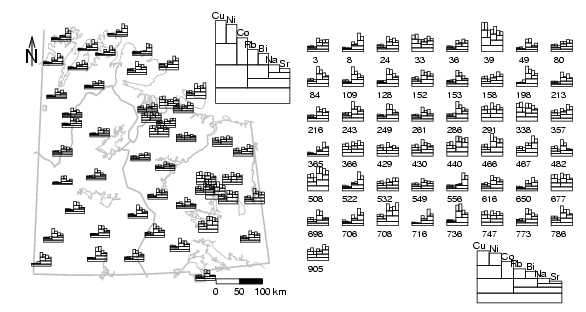
plot(X,Y,frame.plot=FALSE,xaxt="n",yaxt="n",xlab="",ylab="",type="n",
xlim=c(360000,max(X)))
plotbg(map.col=c("gray","gray","gray","gray"),add.plot=T)
tree(x,locations=cbind(X[sel],Y[sel]),len=6000,key.loc=c(760000,7740000),leglen=23000,
leglh=0.35, cex=0.75, add=T, lh=1.8,wmax=0,wmin=0,labels=NULL)
# scalebar
scalebar(761309,7373050,861309,7363050,shifttext=-0.5,shiftkm=37e3,sizetext=0.8)
# North arrow
Northarrow(362602,7818750,362602,7878750,362602,7838750,Alength=0.15,Aangle=15,Alwd=1.3,Tcex=1.6)
par(mar=c(.1,.1,.1,.5))
tree(x,key.loc=c(13,-0.5),len=0.2, lh=2.5,leglh=0.20, wmax=0,wmin=0, leglen=0.8, ncol=8, cex=0.75)
dev.off()