
library(StatDA)
data(chorizon)
x=chorizon[,c("Al2O3","CaO","Fe2O3","K2O","MgO","MnO","Na2O","P2O5","SiO2","TiO2")]
pdf("fig-11-6.pdf",width=7,height=7)
par(mfrow=c(1,1),mar=c(4,4,2,0))
x1=x/x[,"TiO2"]
x1.obj=log10(x1[,1:9])
CorCompare(cor(x1.obj),cor(log10(x[,1:9])),
labels1=dimnames(x)[[2]],labels2=dimnames(x)[[2]],
method1="additive logratio transformation",method2="log-transformation",
ndigits=2)
dev.off()
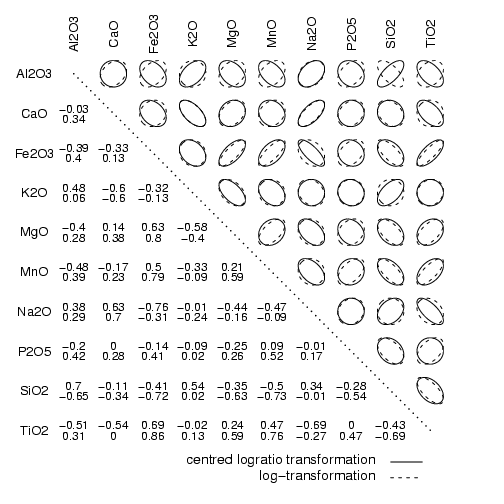
library(StatDA)
data(chorizon)
x=chorizon[,c("Al2O3","CaO","Fe2O3","K2O","MgO","MnO","Na2O","P2O5","SiO2","TiO2","LOI")]
pdf("fig-11-7.pdf",width=7,height=7)
par(mfrow=c(1,1),mar=c(4,4,2,0))
xgeom=10^apply(log10(x),1,mean)
x2=x/xgeom
x2.obj=log10(x2)
CorCompare(cor(x2.obj[,1:10]),cor(log10(x[,1:10])),
labels1=dimnames(x)[[2]],labels2=dimnames(x)[[2]],
method1="centred logratio transformation",method2="log-transformation",
ndigits=2)
dev.off()