library(StatDA)
data(chorizon)
Cu=chorizon[,"Cu"]
pdf("fig-9-6.pdf",width=6,height=4.5)
par(mfrow=c(1,1),mar=c(4,4,2,2))
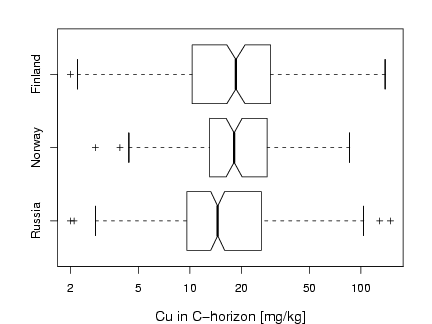
coun=factor(chorizon[,"COUN"],levels=c("RUS","NOR","FIN"),labels=c("Russia","Norway","Finland"))
boxplot(log10(Cu)~coun,horizontal=T,xaxt="n",pch=3,cex=0.8,notch=T,
xlab="Cu in C-horizon [mg/kg]",cex.lab=1.2)
axis(1,at=log10(a<-sort(c((10^(-50:50))%*%t(c(2,5,10))))),labels=a)
dev.off()