library(StatDA)
# need data:
data(nizap)
data(monch)
data(moss)
X=moss[,"XCOO"]
Y=moss[,"YCOO"]
pdf("fig-8-12.pdf",width=9,height=4.5)
par(mfrow=c(1,2),mar=c(0.1,2,0.1,2))
monch.in=in.polygon(X,Y,monch$x,monch$y)
nizap.in=in.polygon(X,Y,nizap$x,nizap$y)
# Other points
other=seq(1,length(X))
other=other[!monch.in & !nizap.in]
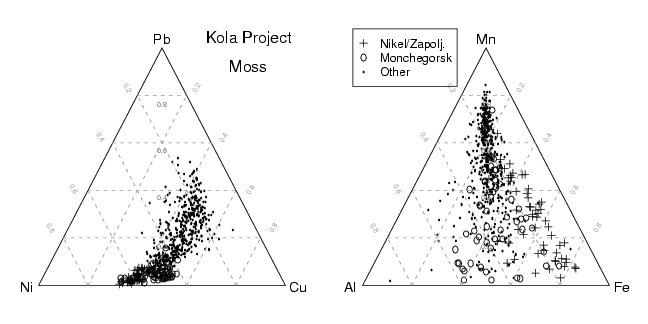
x=moss[,c("Ni","Cu","Pb")]
pch.vec=rep(NA,nrow(x))
pch.vec[nizap.in] <- 3
pch.vec[monch.in] <- 1
pch.vec[other] <- 20
cex.vec=rep(NA,nrow(x))
cex.vec[nizap.in] <- 1.0
cex.vec[monch.in] <- 1.0
cex.vec[other] <- 0.3
ternary(x, pch=pch.vec, cex=cex.vec, col=1, grid=T)
text(0.85,0.9,"Kola Project",cex=1.3)
text(0.85,0.8,"Moss",cex=1.3)
x=moss[,c("Al","Fe","Mn")]
ternary(x, pch=pch.vec, cex=cex.vec, col=1, grid=T)
legend("topleft",legend=c("Nikel/Zapolj.","Monchegorsk","Other"),pch=c(3,1,20),pt.cex=c(1.0,1.0,0.3))
dev.off()