library(StatDA)
data(moss)
data(chorizon)
# only samples from same locations in both layers:
c.ind=NULL
m.ind=NULL
c.id=chorizon[,1]
m.id=moss[,1]
for (i in 1:1000){
if (sum(c.id==i)+sum(m.id==i)==2){
c.ind=c(c.ind,which(c.id==i))
m.ind=c(m.ind,which(m.id==i))
}
}
# Country
coun=chorizon[c.ind,"COUN"]
count=factor(coun,levels=c("FIN","NOR","RUS"),labels=c("Finland","Norway","Russia"))
Cu=moss[m.ind,"Cu"]
Ni=moss[m.ind,"Ni"]
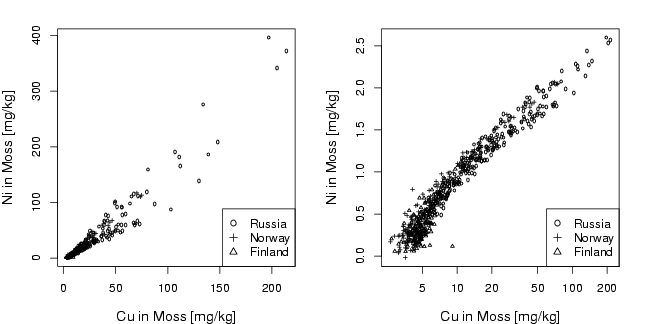
pdf("fig-8-8.pdf",width=9,height=4.5)
par(mfrow=c(1,2),mar=c(4,4,2,2))
plot(Cu,Ni,xlab="Cu in Moss [mg/kg]", ylab="Ni in Moss [mg/kg]", type="n",cex.lab=1.2)
points(Cu[count=="Russia"],Ni[count=="Russia"], pch=1, cex=0.5)
points(Cu[count=="Norway"],Ni[count=="Norway"], pch=3, cex=0.5)
points(Cu[count=="Finland"],Ni[count=="Finland"], pch=2, cex=0.5)
legend("bottomright",legend=c("Russia","Norway","Finland"),pch=c(1,3,2))
plot(log10(Cu),log10(Ni),xlab="Cu in Moss [mg/kg]", ylab="Ni in Moss [mg/kg]",
xaxt="n", pch=3, cex=0.7, type="n",cex.lab=1.2)
axis(1,at=log10(a<-sort(c((10^(-50:50))%*%t(c(2,5,10))))),labels=a)
points(log10(Cu[count=="Russia"]),log10(Ni[count=="Russia"]), pch=1, cex=0.5)
points(log10(Cu[count=="Norway"]),log10(Ni[count=="Norway"]), pch=3, cex=0.5)
points(log10(Cu[count=="Finland"]),log10(Ni[count=="Finland"]), pch=2, cex=0.5)
legend("bottomright",legend=c("Russia","Norway","Finland"),pch=c(1,3,2))
dev.off()
library(StatDA)
# need also this package:
library(sgeostat)
# need data:
data(moss)
data(kola.background)
data(nizap)
data(monch)
#plotbg()
#points(moss[,"XCOO"],moss[,"YCOO"],col=2)
#nizap=locator(type="l")
#dump("nizap","../Data/nizap.R")
#polygon(a$x,a$y,border=2)
#aa=in.polygon(xcoo,ycoo,a$x,a$y)
#points(xcoo[aa],ycoo[aa],col="darkblue",pch=20,cex=z[aa]/max(z)+0.2)
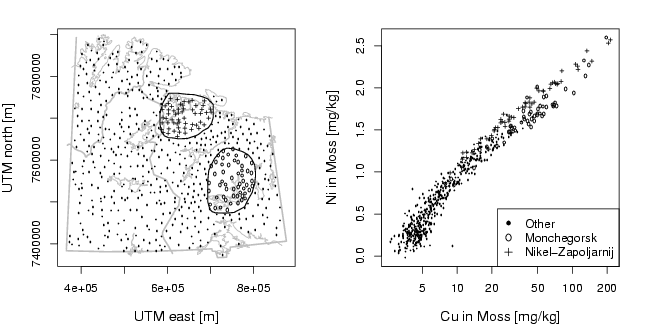
pdf("fig-8-9.pdf",width=9,height=4.5)
par(mfrow=c(1,2),mar=c(4,4,2,2))
Cu=moss[,"Cu"]
Ni=moss[,"Ni"]
X=moss[,"XCOO"]
Y=moss[,"YCOO"]
plotbg(map.col=c("gray","gray","gray","gray"), xlab="UTM east [m]", ylab="UTM north [m]",
cex.lab=1.2)
polygon(monch$x,monch$y,border=1,lwd=1.3)
monch.in=in.polygon(X,Y,monch$x,monch$y)
points(X[monch.in],Y[monch.in],pch=1,cex=0.5)
polygon(nizap$x,nizap$y,border=1,lwd=1.3)
nizap.in=in.polygon(X,Y,nizap$x,nizap$y)
points(X[nizap.in],Y[nizap.in],pch=3,cex=0.5)
# Other points
other=seq(1,length(X))
other=other[!monch.in & !nizap.in]
points(X[other],Y[other],pch=20,cex=0.2)
plot(log10(Cu),log10(Ni),xlab="Cu in Moss [mg/kg]", ylab="Ni in Moss [mg/kg]",
xaxt="n", pch=3, cex=0.7, type="n",cex.lab=1.2)
axis(1,at=log10(a<-sort(c((10^(-50:50))%*%t(c(2,5,10))))),labels=a)
points(log10(Cu[other]),log10(Ni[other]), pch=20, cex=0.2)
points(log10(Cu[monch.in]),log10(Ni[monch.in]), pch=1, cex=0.5)
points(log10(Cu[nizap.in]),log10(Ni[nizap.in]), pch=3, cex=0.5)
legend("bottomright",legend=c("Other","Monchegorsk","Nikel-Zapoljarnij"),pch=c(20,1,3))
dev.off()