library(StatDA)
data(ohorizon)
data(kola.background)
data(chorizon)
# only samples from same locations in both layers:
c.ind=NULL
o.ind=NULL
c.id=chorizon[,1]
o.id=ohorizon[,1]
for (i in 1:1000){
if (sum(c.id==i)+sum(o.id==i)==2){
c.ind=c(c.ind,which(c.id==i))
o.ind=c(o.ind,which(o.id==i))
}
}
coun=chorizon[c.ind,"COUN"]
count=factor(coun,levels=c("FIN","NOR","RUS"),labels=c("Finland","Norway","Russia"))
pdf("fig-8-6.pdf",width=9,height=4.5)
par(mfrow=c(1,2),mar=c(4,4,2,2))
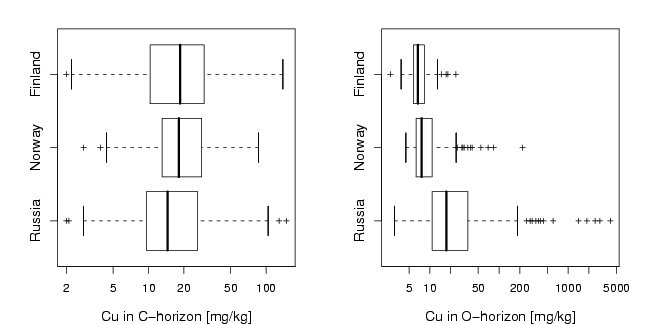
el=chorizon[c.ind,"Cu"]
boxplotlog(el[count=="Russia"],el[count=="Norway"],el[count=="Finland"],
horizontal=T,xlab=paste("Cu in C-horizon [mg/kg]",sep=""),cex=0.7,cex.axis=1.2,
log="x",cex.lab=1.2,pch=3,names=c("Russia","Norway","Finland"),xaxt="n")
axis(1,at=(a<-sort(c((10^(-50:50))%*%t(c(2,5,10))))),labels=a)
el=ohorizon[o.ind,"Cu"]
boxplotlog(el[count=="Russia"],el[count=="Norway"],el[count=="Finland"],
horizontal=T,xlab=paste("Cu in O-horizon [mg/kg]",sep=""),cex=0.7,cex.axis=1.2,
log="x",cex.lab=1.2,pch=3,names=c("Russia","Norway","Finland"),xaxt="n")
axis(1,at=(a<-sort(c((10^(-50:50))%*%t(c(2,5,10))))),labels=a)
dev.off()
library(StatDA)
data(ohorizon)
data(kola.background)
data(chorizon)
# only samples from same locations in both layers:
c.ind=NULL
o.ind=NULL
c.id=chorizon[,1]
o.id=ohorizon[,1]
for (i in 1:1000){
if (sum(c.id==i)+sum(o.id==i)==2){
c.ind=c(c.ind,which(c.id==i))
o.ind=c(o.ind,which(o.id==i))
}
}
lit=chorizon[c.ind,"LITO"]
litolog=rep(NA, length(lit))
litolog[lit==10] <- 1
litolog[lit==52] <- 2
litolog[lit==81 | lit==82 | lit==83] <- 3
litolog[lit==7] <- 4
lito <- litolog[!is.na(litolog)]
lito <- factor(lito, labels=c("CS","B","AR","G"))
pdf("fig-8-7.pdf",width=8,height=8)
par(mfrow=c(2,2),mar=c(4,4,2,2))
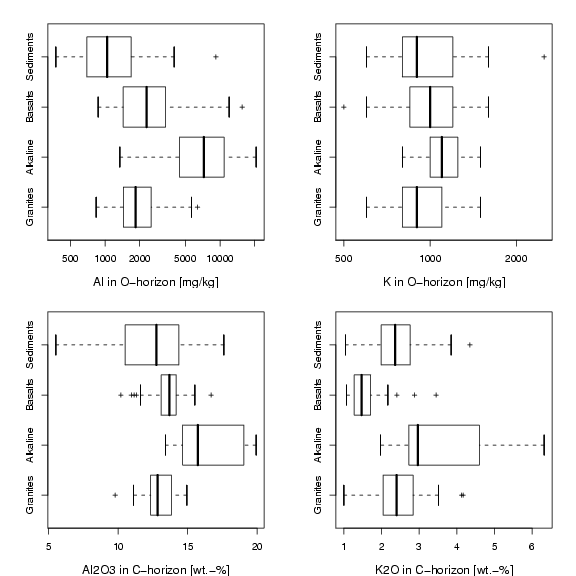
el=ohorizon[o.ind[!is.na(litolog)],"Al"]
boxplotlog(el[lito=="G"],el[lito=="AR"],el[lito=="B"],el[lito=="CS"],
horizontal=T,xlab=paste("Al in O-horizon [mg/kg]",sep=""),cex=0.7,cex.axis=1.0,
log="x",cex.lab=1.2,pch=3,names=c("Granites","Alkaline","Basalts","Sediments"),
xaxt="n")
axis(1,at=(a<-sort(c((10^(-50:50))%*%t(c(2,5,10))))),labels=a)
el=ohorizon[o.ind[!is.na(litolog)],"K"]
boxplotlog(el[lito=="G"],el[lito=="AR"],el[lito=="B"],el[lito=="CS"],
horizontal=T,xlab=paste("K in O-horizon [mg/kg]",sep=""),cex=0.7,cex.axis=1.0,
log="x",cex.lab=1.2,pch=3,names=c("Granites","Alkaline","Basalts","Sediments"),
xaxt="n")
axis(1,at=(a<-sort(c((10^(-50:50))%*%t(c(2,5,10))))),labels=a)
el=chorizon[c.ind[!is.na(litolog)],"Al2O3"]
boxplot(el[lito=="G"],el[lito=="AR"],el[lito=="B"],el[lito=="CS"],
horizontal=T,xlab=paste("Al2O3 in C-horizon [wt.-%]",sep=""),cex=0.7,cex.axis=1.0,
cex.lab=1.2,pch=3,names=c("Granites","Alkaline","Basalts","Sediments"))
el=chorizon[c.ind[!is.na(litolog)],"K2O"]
boxplot(el[lito=="G"],el[lito=="AR"],el[lito=="B"],el[lito=="CS"],
horizontal=T,xlab=paste("K2O in C-horizon [wt.-%]",sep=""),cex=0.7,cex.axis=1.0,
cex.lab=1.2,pch=3,names=c("Granites","Alkaline","Basalts","Sediments"))
dev.off()