library(StatDA)
data(ohorizon)
data(kola.background)
X=ohorizon[,"XCOO"]
Y=ohorizon[,"YCOO"]
# true representation of x and y axis of map for plot
xwid=diff(range(X))/12e4
ywid=diff(range(Y))/12e4
pdf("fig-7-8.pdf",width=2*xwid,height=3*ywid)
par(mfrow=c(3,2),mar=c(1.5,1.5,1.5,1.5))
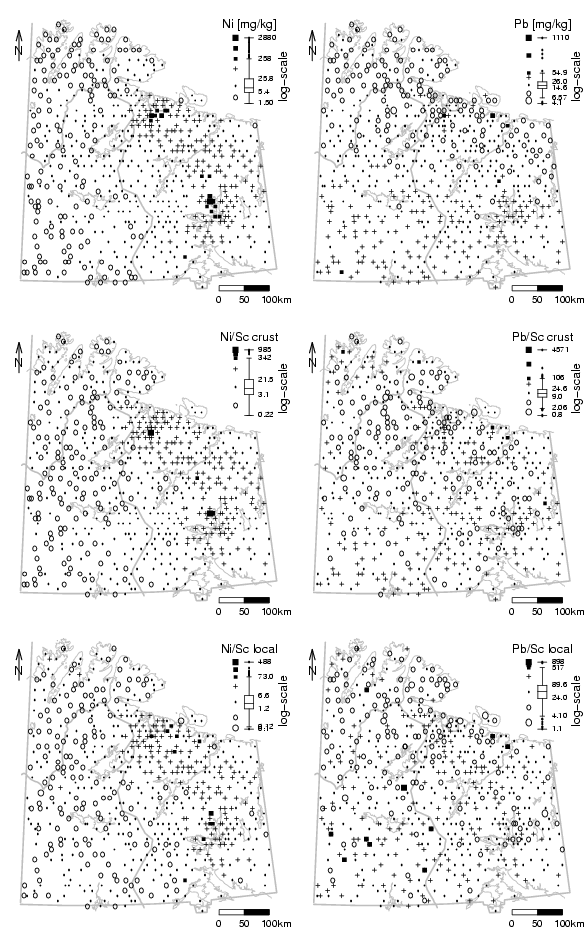
### NEW MAP: Ni
el=ohorizon[,"Ni"]
# generate plot with background
plot(X,Y,frame.plot=FALSE,xaxt="n",yaxt="n",xlab="",ylab="",type="n")
plotbg(map.col=c("gray","gray","gray","gray"),add.plot=T)
SymbLegend(X,Y,el,type="boxplot",qutiles<-c(0,0.05,0.25,0.75,0.95,1),symbtype="EDA",symbmagn=0.8,
leg.position="topright",leg.title="Ni [mg/kg]",leg.title.cex=1.5,leg.round=2,leg.wid=4,
leg.just="right",cex.scale=1.0,xf=9e3,logscale=TRUE,accentuate=TRUE)
# scalebar
scalebar(761309,7373050,861309,7363050,shifttext=-0.3,shiftkm=31e3,sizetext=0.8)
# North arrow
Northarrow(362602,7818750,362602,7878750,362602,7838750,Alength=0.15,Aangle=15,Alwd=1.3,Tcex=1.6)
### NEW MAP: Pb
el=ohorizon[,"Pb"]
# generate plot with background
plot(X,Y,frame.plot=FALSE,xaxt="n",yaxt="n",xlab="",ylab="",type="n")
plotbg(map.col=c("gray","gray","gray","gray"),add.plot=T)
SymbLegend(X,Y,el,type="boxplot",qutiles<-c(0,0.05,0.25,0.75,0.95,1),symbtype="EDA",symbmagn=0.8,
leg.position="topright",leg.title="Pb [mg/kg]",leg.title.cex=1.5,leg.round=2,leg.wid=4,
leg.just="right",cex.scale=1.0,xf=9e3,logscale=TRUE,accentuate=TRUE)
# scalebar
scalebar(761309,7373050,861309,7363050,shifttext=-0.3,shiftkm=31e3,sizetext=0.8)
# North arrow
Northarrow(362602,7818750,362602,7878750,362602,7838750,Alength=0.15,Aangle=15,Alwd=1.3,Tcex=1.6)
### NEW MAP: EF Ni/Sc crust
el=(ohorizon[,"Ni"]/ohorizon[,"Sc"])/(18.6/7)
# generate plot with background
plot(X,Y,frame.plot=FALSE,xaxt="n",yaxt="n",xlab="",ylab="",type="n")
plotbg(map.col=c("gray","gray","gray","gray"),add.plot=T)
SymbLegend(X,Y,el,type="boxplot",qutiles<-c(0,0.05,0.25,0.75,0.95,1),symbtype="EDA",symbmagn=0.8,
leg.position="topright",leg.title="Ni/Sc crust",leg.title.cex=1.5,leg.round=2,leg.wid=4,
leg.just="right",cex.scale=1.0,xf=9e3,logscale=TRUE,accentuate=TRUE)
# scalebar
scalebar(761309,7373050,861309,7363050,shifttext=-0.3,shiftkm=31e3,sizetext=0.8)
# North arrow
Northarrow(362602,7818750,362602,7878750,362602,7838750,Alength=0.15,Aangle=15,Alwd=1.3,Tcex=1.6)
### NEW MAP: EF Pb/Sc crust
el=(ohorizon[,"Pb"]/ohorizon[,"Sc"])/(17/7)
# generate plot with background
plot(X,Y,frame.plot=FALSE,xaxt="n",yaxt="n",xlab="",ylab="",type="n")
plotbg(map.col=c("gray","gray","gray","gray"),add.plot=T)
SymbLegend(X,Y,el,type="boxplot",qutiles<-c(0,0.05,0.25,0.75,0.95,1),symbtype="EDA",symbmagn=0.8,
leg.position="topright",leg.title="Pb/Sc crust",leg.title.cex=1.5,leg.round=2,leg.wid=4,
leg.just="right",cex.scale=1.0,xf=9e3,logscale=TRUE,accentuate=TRUE)
# scalebar
scalebar(761309,7373050,861309,7363050,shifttext=-0.3,shiftkm=31e3,sizetext=0.8)
# North arrow
Northarrow(362602,7818750,362602,7878750,362602,7838750,Alength=0.15,Aangle=15,Alwd=1.3,Tcex=1.6)
### NEW MAP: EF Ni/Sc local
data(chorizon)
# only samples from same locations in both layers:
c.ind=NULL
o.ind=NULL
c.id=chorizon[,1]
o.id=ohorizon[,1]
for (i in 1:1000){
if (sum(c.id==i)+sum(o.id==i)==2){
c.ind=c(c.ind,which(c.id==i))
o.ind=c(o.ind,which(o.id==i))
}
}
X=ohorizon[o.ind,"XCOO"]
Y=ohorizon[o.ind,"YCOO"]
el1O=ohorizon[o.ind,"Ni"]
el2O=ohorizon[o.ind,"Sc"]
el1C=chorizon[c.ind,"Ni"]
el2C=chorizon[c.ind,"Sc"]
el=(el1O/el2O)/(el1C/el2C)
# generate plot with background
plot(X,Y,frame.plot=FALSE,xaxt="n",yaxt="n",xlab="",ylab="",type="n")
plotbg(map.col=c("gray","gray","gray","gray"),add.plot=T)
SymbLegend(X,Y,el,type="boxplot",qutiles<-c(0,0.05,0.25,0.75,0.95,1),symbtype="EDA",symbmagn=0.8,
leg.position="topright",leg.title="Ni/Sc local",leg.title.cex=1.5,leg.round=2,leg.wid=4,
leg.just="right",cex.scale=1.0,xf=9e3,logscale=TRUE,accentuate=TRUE)
# scalebar
scalebar(761309,7373050,861309,7363050,shifttext=-0.3,shiftkm=31e3,sizetext=0.8)
# North arrow
Northarrow(362602,7818750,362602,7878750,362602,7838750,Alength=0.15,Aangle=15,Alwd=1.3,Tcex=1.6)
### NEW MAP: EF Pb/Sc local
# only samples from same locations in both layers:
c.ind=NULL
o.ind=NULL
c.id=chorizon[,1]
o.id=ohorizon[,1]
for (i in 1:1000){
if (sum(c.id==i)+sum(o.id==i)==2){
c.ind=c(c.ind,which(c.id==i))
o.ind=c(o.ind,which(o.id==i))
}
}
X=ohorizon[o.ind,"XCOO"]
Y=ohorizon[o.ind,"YCOO"]
el1O=ohorizon[o.ind,"Pb"]
el2O=ohorizon[o.ind,"Sc"]
el1C=chorizon[c.ind,"Pb"]
el2C=chorizon[c.ind,"Sc"]
el1O=el1O[!is.na(el1C)]
el2O=el2O[!is.na(el1C)]
el2C=el2C[!is.na(el1C)]
el1C=el1C[!is.na(el1C)]
el=(el1O/el2O)/(el1C/el2C)
# generate plot with background
plot(X,Y,frame.plot=FALSE,xaxt="n",yaxt="n",xlab="",ylab="",type="n")
plotbg(map.col=c("gray","gray","gray","gray"),add.plot=T)
SymbLegend(X,Y,el,type="boxplot",qutiles<-c(0,0.05,0.25,0.75,0.95,1),symbtype="EDA",symbmagn=0.8,
leg.position="topright",leg.title="Pb/Sc local",leg.title.cex=1.5,leg.round=2,leg.wid=4,
leg.just="right",cex.scale=1.0,xf=9e3,logscale=TRUE,accentuate=TRUE)
# scalebar
scalebar(761309,7373050,861309,7363050,shifttext=-0.3,shiftkm=31e3,sizetext=0.8)
# North arrow
Northarrow(362602,7818750,362602,7878750,362602,7838750,Alength=0.15,Aangle=15,Alwd=1.3,Tcex=1.6)
dev.off()
library(StatDA)
data(moss)
data(kola.background)
X=moss[,"XCOO"]
Y=moss[,"YCOO"]
# true representation of x and y axis of map for plot
xwid=diff(range(X))/12e4
ywid=diff(range(Y))/12e4
pdf("fig-7-9.pdf",width=2*xwid,height=2*ywid)
par(mfrow=c(2,2),mar=c(1.5,1.5,1.5,1.5))
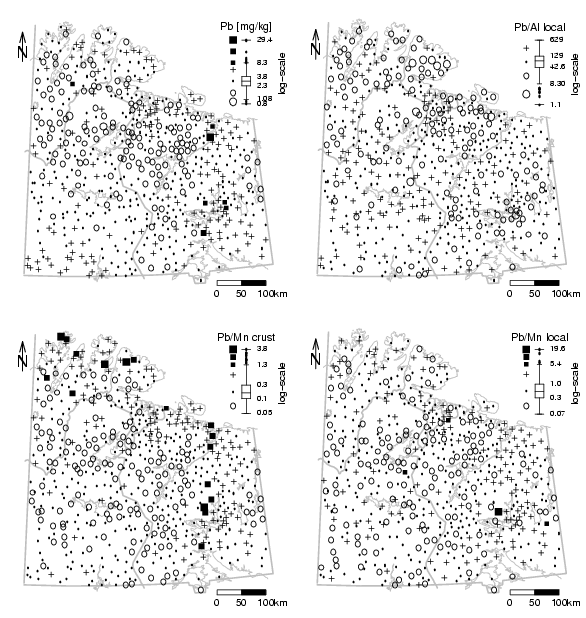
### NEW MAP: Pb
X=moss[,"XCOO"]
Y=moss[,"YCOO"]
el=moss[,"Pb"]
# generate plot with background
plot(X,Y,frame.plot=FALSE,xaxt="n",yaxt="n",xlab="",ylab="",type="n")
plotbg(map.col=c("gray","gray","gray","gray"),add.plot=T)
SymbLegend(X,Y,el,type="boxplot",qutiles<-c(0,0.05,0.25,0.75,0.95,1),symbtype="EDA",symbmagn=0.8,
leg.position="topright",leg.title="Pb [mg/kg]",leg.title.cex=1.1,leg.round=2,leg.wid=4,
leg.just="right",cex.scale=0.8,xf=9e3,logscale=TRUE,accentuate=TRUE)
# scalebar
scalebar(761309,7373050,861309,7363050,shifttext=-0.3,shiftkm=31e3,sizetext=0.8)
# North arrow
Northarrow(362602,7818750,362602,7878750,362602,7838750,Alength=0.15,Aangle=15,Alwd=1.3,Tcex=1.6)
### NEW MAP: EF Pb/Al local
data(chorizon)
# only samples from same locations in both layers:
c.ind=NULL
m.ind=NULL
c.id=chorizon[,1]
m.id=moss[,1]
for (i in 1:1000){
if (sum(c.id==i)+sum(m.id==i)==2){
c.ind=c(c.ind,which(c.id==i))
m.ind=c(m.ind,which(m.id==i))
}
}
X=moss[m.ind,"XCOO"]
Y=moss[m.ind,"YCOO"]
el1M=moss[m.ind,"Pb"]
el2M=moss[m.ind,"Al"]
el1C=chorizon[c.ind,"Pb"]
el2C=chorizon[c.ind,"Al"]
el1M=el1M[!is.na(el1C)]
el2M=el2M[!is.na(el1C)]
el2C=el2C[!is.na(el1C)]
el1C=el1C[!is.na(el1C)]
el=(el1M/el2M)/(el1C/el2C)
# generate plot with background
plot(X,Y,frame.plot=FALSE,xaxt="n",yaxt="n",xlab="",ylab="",type="n")
plotbg(map.col=c("gray","gray","gray","gray"),add.plot=T)
SymbLegend(X,Y,el,type="boxplot",qutiles<-c(0,0.05,0.25,0.75,0.95,1),symbtype="EDA",symbmagn=0.8,
leg.position="topright",leg.title="Pb/Al local",leg.title.cex=1.1,leg.round=2,leg.wid=4,
leg.just="right",cex.scale=0.8,xf=9e3,logscale=TRUE,accentuate=TRUE)
# scalebar
scalebar(761309,7373050,861309,7363050,shifttext=-0.3,shiftkm=31e3,sizetext=0.8)
# North arrow
Northarrow(362602,7818750,362602,7878750,362602,7838750,Alength=0.15,Aangle=15,Alwd=1.3,Tcex=1.6)
### NEW MAP: EF Pb/Mn crust
X=moss[,"XCOO"]
Y=moss[,"YCOO"]
el=(moss[,"Pb"]/moss[,"Mn"])/(17/527)
# generate plot with background
plot(X,Y,frame.plot=FALSE,xaxt="n",yaxt="n",xlab="",ylab="",type="n")
plotbg(map.col=c("gray","gray","gray","gray"),add.plot=T)
SymbLegend(X,Y,el,type="boxplot",qutiles<-c(0,0.05,0.25,0.75,0.95,1),symbtype="EDA",symbmagn=0.8,
leg.position="topright",leg.title="Pb/Mn crust",leg.title.cex=1.1,leg.round=2,leg.wid=4,
leg.just="right",cex.scale=0.8,xf=9e3,logscale=TRUE,accentuate=TRUE)
# scalebar
scalebar(761309,7373050,861309,7363050,shifttext=-0.3,shiftkm=31e3,sizetext=0.8)
# North arrow
Northarrow(362602,7818750,362602,7878750,362602,7838750,Alength=0.15,Aangle=15,Alwd=1.3,Tcex=1.6)
### NEW MAP: EF Pb/Mn local
# only samples from same locations in both layers:
c.ind=NULL
m.ind=NULL
c.id=chorizon[,1]
m.id=moss[,1]
for (i in 1:1000){
if (sum(c.id==i)+sum(m.id==i)==2){
c.ind=c(c.ind,which(c.id==i))
m.ind=c(m.ind,which(m.id==i))
}
}
X=moss[m.ind,"XCOO"]
Y=moss[m.ind,"YCOO"]
el1M=moss[m.ind,"Pb"]
el2M=moss[m.ind,"Mn"]
el1C=chorizon[c.ind,"Pb"]
el2C=chorizon[c.ind,"Mn"]
el1M=el1M[!is.na(el1C)]
el2M=el2M[!is.na(el1C)]
el2C=el2C[!is.na(el1C)]
el1C=el1C[!is.na(el1C)]
el=(el1M/el2M)/(el1C/el2C)
# generate plot with background
plot(X,Y,frame.plot=FALSE,xaxt="n",yaxt="n",xlab="",ylab="",type="n")
plotbg(map.col=c("gray","gray","gray","gray"),add.plot=T)
SymbLegend(X,Y,el,type="boxplot",qutiles<-c(0,0.05,0.25,0.75,0.95,1),symbtype="EDA",symbmagn=0.8,
leg.position="topright",leg.title="Pb/Mn local",leg.title.cex=1.1,leg.round=2,leg.wid=4,
leg.just="right",cex.scale=0.8,xf=9e3,logscale=TRUE,accentuate=TRUE)
# scalebar
scalebar(761309,7373050,861309,7363050,shifttext=-0.3,shiftkm=31e3,sizetext=0.8)
# North arrow
Northarrow(362602,7818750,362602,7878750,362602,7838750,Alength=0.15,Aangle=15,Alwd=1.3,Tcex=1.6)
dev.off()
library(StatDA)
data(ohorizon)
data(chorizon)
# only samples from same locations in both layers:
c.ind=NULL
o.ind=NULL
c.id=chorizon[,1]
o.id=ohorizon[,1]
for (i in 1:1000){
if (sum(c.id==i)+sum(o.id==i)==2){
c.ind=c(c.ind,which(c.id==i))
o.ind=c(o.ind,which(o.id==i))
}
}
ScO=ohorizon[o.ind,"Sc"]
ScC=chorizon[c.ind,"Sc"]
pdf("fig-7-10.pdf",paper="special",width=9,height=5)
par(mar=c(3,5,1,1))
par(mfrow=c(1,1))
#sel=c("Ag","As","Bi","Cd","Co","Cr","Cu","Ni","Pb","S","Sb","Tl","V","Zn")
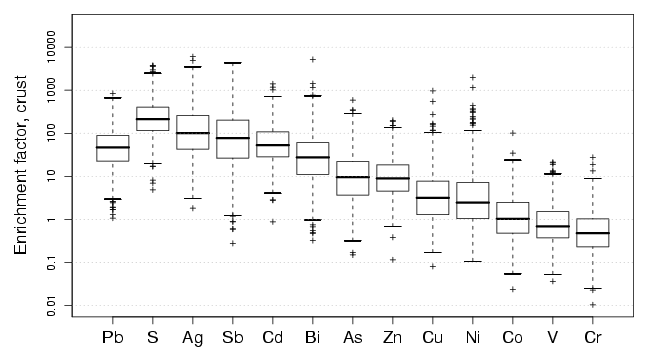
sel=c("Ag","As","Bi","Cd","Co","Cr","Cu","Ni","Pb","S","Sb","V","Zn")
#EF=c(0.06,2,0.12,0.1,11.6,35,14.3,18.6,17,300,0.31,0.75,53,52)
datO=as.data.frame(t(t(ohorizon[o.ind,sel])/ScO))
datC=as.data.frame(t(t(chorizon[c.ind,sel])/ScC))
dat.sel=datO/datC
boxplot(log10(dat.sel),at=ncol(dat.sel)+1-rank(apply(dat.sel,2,median)),cex.axis=1.4,
cex.lab=1.4,pch=3,yaxt="n",cex=0.7,ylim=c(-2,4.5),ylab="Enrichment factor, crust")
axis(2,at=log10(a<-sort(c((10^(-50:50))%*%t(c(10))))),labels=a,cex=1.5)
abline(h=log10(a),lty=3,col=gray(0.6))
dev.off()