library(StatDA)
data(ohorizon)
data(moss)
data(bhorizon)
data(chorizon)
pdf("fig-6-11.pdf",width=9,height=4.5)
par(mfrow=c(1,1),mar=c(4,4,2,2))
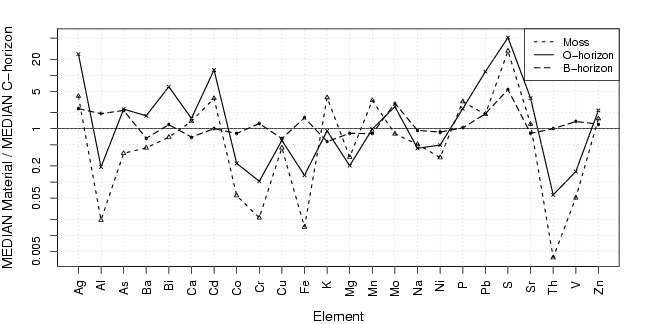
el=c("Ag","Al","As","Ba","Bi","Ca","Cd","Co","Cr","Cu","Fe","K","Mg",
"Mn","Mo","Na","Ni","P","Pb","S","Sr","Th","V","Zn")
x.ref=apply(chorizon[,el],2,median,na.rm=TRUE)
x=cbind(apply(moss[,el],2,median)/x.ref,apply(ohorizon[,el],2,median)/x.ref,
apply(bhorizon[,el],2,median)/x.ref)
x=log10(x)
plot(1:nrow(x),x[,1],type="n",xlab="Element",ylab="MEDIAN Material / MEDIAN C-horizon",xaxt="n",
yaxt="n",ylim=c(min(x),max(x)),cex.lab=1.2)
axis(2,at=log10(a<-sort(c((10^(-50:50))%*%t(c(2,5,10))))),labels=a)
axis(1,at=1:length(el),labels=el, las=3)
points(1:nrow(x),x[,1],pch=2,lty=2,cex=0.6,type="p")
points(1:nrow(x),x[,1],pch=2,lty=2,cex=0.6,type="l",lwd=1.3)
points(1:nrow(x),x[,2],pch=4,lty=1,cex=0.6,type="p")
points(1:nrow(x),x[,2],pch=4,lty=1,cex=0.6,type="l",lwd=1.3)
points(1:nrow(x),x[,3],pch=16,lty=5,cex=0.4,type="p")
points(1:nrow(x),x[,3],pch=16,lty=5,cex=0.4,type="l",lwd=1.3)
abline(h=0,col=1,lwd=1)
abline(v=seq(1,length(el)),lty=3, col="gray")
abline(h=log10(a),lty=3, col="gray")
legend("topright",legend=c("Moss","O-horizon","B-horizon"),lty=c(2,1,5),
cex=0.9,lwd=c(1.3,1.3,1.3),bg="white")
dev.off()
library(StatDA)
data(ohorizon)
data(moss)
data(bhorizon)
data(chorizon)
pdf("fig-6-12.pdf",width=9,height=4.5)
par(mfrow=c(1,1),mar=c(4,4,2,2))
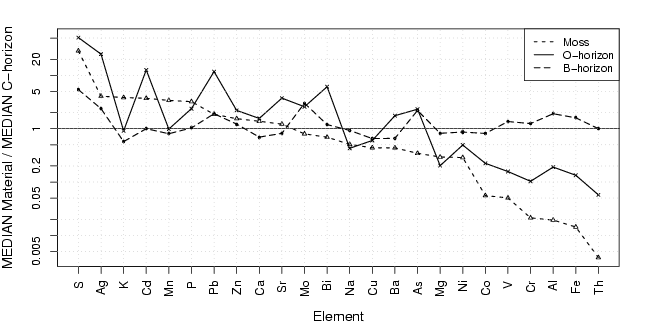
el=c("Ag","Al","As","Ba","Bi","Ca","Cd","Co","Cr","Cu","Fe","K","Mg",
"Mn","Mo","Na","Ni","P","Pb","S","Sr","Th","V","Zn")
x.ref=apply(chorizon[,el],2,median,na.rm=TRUE)
x=cbind(apply(moss[,el],2,median)/x.ref,apply(ohorizon[,el],2,median)/x.ref,
apply(bhorizon[,el],2,median)/x.ref)
x=log10(x)
x.ind=sort(x[,1],index.return=T,decreasing=T)
x=x[x.ind$ix,]
el=el[x.ind$ix]
plot(1:nrow(x),x[,1],type="n",xlab="Element",ylab="MEDIAN Material / MEDIAN C-horizon",xaxt="n",
yaxt="n",ylim=c(min(x),max(x)),cex.lab=1.2)
axis(2,at=log10(a<-sort(c((10^(-50:50))%*%t(c(2,5,10))))),labels=a)
axis(1,at=1:length(el),labels=el, las=3)
points(1:nrow(x),x[,1],pch=2,lty=2,cex=0.6,type="p")
points(1:nrow(x),x[,1],pch=2,lty=2,cex=0.6,type="l",lwd=1.3)
points(1:nrow(x),x[,2],pch=4,lty=1,cex=0.6,type="p")
points(1:nrow(x),x[,2],pch=4,lty=1,cex=0.6,type="l",lwd=1.3)
points(1:nrow(x),x[,3],pch=16,lty=5,cex=0.4,type="p")
points(1:nrow(x),x[,3],pch=16,lty=5,cex=0.4,type="l",lwd=1.3)
abline(h=0,col=1,lwd=1)
abline(v=seq(1,length(el)),lty=3, col="gray")
abline(h=log10(a),lty=3, col="gray")
legend("topright",legend=c("Moss","O-horizon","B-horizon"),lty=c(2,1,5),
cex=0.9,lwd=c(1.3,1.3,1.3),bg="white")
dev.off()