library(StatDA)
data(moss)
# Country
Cu=moss[,"Cu"]
Ni=moss[,"Ni"]
pdf("fig-6-1.pdf",width=9,height=4.5)
par(mfrow=c(1,2),mar=c(4,4,2,2))
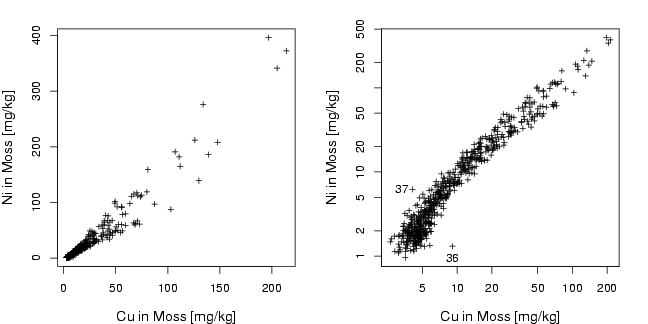
plot(Cu,Ni,xlab="Cu in Moss [mg/kg]", ylab="Ni in Moss [mg/kg]",pch=3, cex=0.7,cex.lab=1.2)
plot(log10(Cu),log10(Ni),xlab="Cu in Moss [mg/kg]", ylab="Ni in Moss [mg/kg]",
xaxt="n", yaxt="n", pch=3, cex=0.7,cex.lab=1.2)
axis(1,at=log10(a<-sort(c((10^(-50:50))%*%t(c(2,5,10))))),labels=a)
axis(2,at=log10(a<-sort(c((10^(-50:50))%*%t(c(2,5,10))))),labels=a)
text(log10(9.1),-0.02,moss[30,"ID"])
text(log10(3.3),0.8,moss[31,"ID"])
dev.off()