library(StatDA)
data(ohorizon)
data(kola.background)
data(bordersKola)
# Packages for Krige results:
X=ohorizon[,"XCOO"]
Y=ohorizon[,"YCOO"]
# true representation of x and y axis of map for plot
xwid=diff(range(X))/12e4
ywid=diff(range(Y))/12e4
pdf("fig-5-10.pdf",width=2*xwid,height=1*ywid)
par(mfrow=c(1,2),mar=c(4,4,2,2))
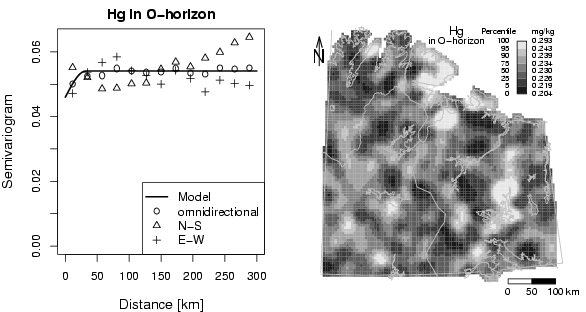
el="Hg"
dat=ohorizon[,el]
#vario.b=varioCalc(X,Y,el=ohorizon[,el],max.dist=300000,title=paste(el,"in O-horizon"))
#res.eyefit=eyefit(vario.b)
#dump("res.eyefit","../Data/res.eyefit.Hg_O")
data(res.eyefit.Hg_O)
vario.b=varioCalc(X,Y,el=dat,max.dist=300000,title=paste(el,"in O-horizon"),km=FALSE)
v5=variofit(vario.b,res.eyefit.Hg_O,cov.model="spherical",max.dist=300000)
lines(v5,col=1,lwd=2)
par(mar=c(1.5,1.5,1.5,1.5))
#################################################################################
# NEW Krige map: percentile scale
# generate plot
plot(X,Y,frame.plot=FALSE,xaxt="n",yaxt="n",xlab="",ylab="",type="n")
KrigeLegend(X,Y,dat,resol=100,vario=v5,type="percentile",whichcol="gray",
qutiles=c(0,0.05,0.25,0.50,0.75,0.90,0.95,1),borders="bordersKola",
leg.xpos.min=7.8e5,leg.xpos.max=8.0e5,leg.ypos.min=77.6e5,leg.ypos.max=78.7e5,
leg.title="mg/kg", leg.title.cex=0.7, leg.numb.cex=0.7, leg.round=3,
leg.numb.xshift=0.7e5,leg.perc.xshift=0.4e5,leg.perc.yshift=0.2e5,tit.xshift=0.35e5)
# plot background
plotbg(map.col=c("gray","gray","gray","gray"),map.lwd=c(1,1,1,1),add.plot=T)
# Text
text(min(X)+diff(range(X))*4/7,max(Y),"Hg",cex=1)
text(min(X)+diff(range(X))*4/7,max(Y)-diff(range(Y))/28,"in O-horizon",cex=0.8)
# scalebar
scalebar(761309,7373050,861309,7363050,shifttext=-0.5,shiftkm=37e3,sizetext=0.8)
# North arrow
Northarrow(362602,7818750,362602,7878750,362602,7838750,Alength=0.15,Aangle=15,Alwd=1.3,Tcex=1.6)
dev.off()
library(StatDA)
data(ohorizon)
data(kola.background)
data(bordersKola)
# Packages for Krige results:
X=ohorizon[,"XCOO"]
Y=ohorizon[,"YCOO"]
# true representation of x and y axis of map for plot
xwid=diff(range(X))/12e4
ywid=diff(range(Y))/12e4
pdf("fig-5-11.pdf",width=2*xwid,height=2*ywid)
par(mfrow=c(2,2),mar=c(4,4,2,2))
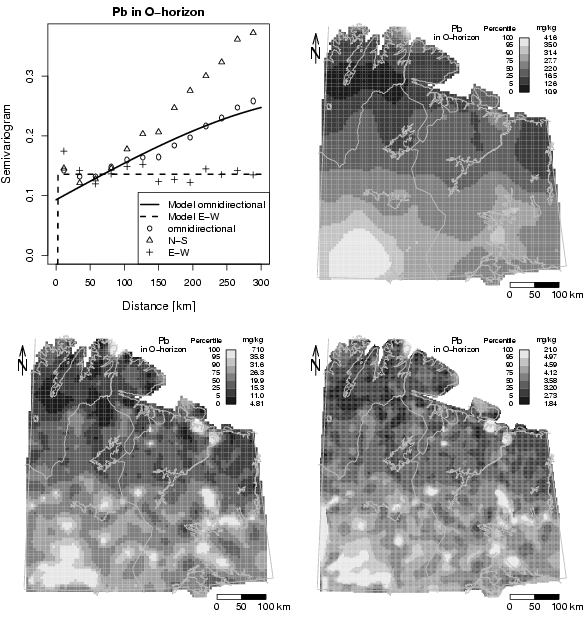
el="Pb"
dat=ohorizon[,el]
#vario.b=varioCalc(X,Y,el=ohorizon[,el],max.dist=300000,title=paste(el,"in O-horizon"))
#res.eyefit=eyefit(vario.b)
#dump("res.eyefit","../Data/res.eyefit.Pb_O1")
data(res.eyefit.Pb_O1)
#vario.90 <- variog(coords=cbind(X,Y),data=ohorizon[,el],lambda=0,max.dist=300000, dir=pi/2,tol=pi/8)
#res.eyefit=eyefit(vario.90)
#dump("res.eyefit","../Data/res.eyefit.Pb_O2")
data(res.eyefit.Pb_O2)
vario.b <- variog(coords=cbind(X,Y),data=ohorizon[,el],lambda=0,max.dist=300000)
v5.b=variofit(vario.b,res.eyefit.Pb_O2,cov.model="spherical",max.dist=300000)
vario.90 <- variog(coords=cbind(X,Y),data=ohorizon[,el],lambda=0,max.dist=300000, dir=pi/2,tol=pi/8)
v5.90=variofit(vario.90,res.eyefit.Pb_O2,cov.model="spherical",max.dist=300000)
# Plot variograms
vario.0 <- variog(coords=cbind(X,Y),data=ohorizon[,el],lambda=0,max.dist=300000, dir=0,tol=pi/8)
ymax=max(vario.b$v,vario.0$v,vario.90$v)
plot(0,0,xlab="Distance [km]",ylab="Semivariogram",xlim=c(0,300000),
ylim=c(0,ymax),cex.lab=1.2,type="n",xaxt="n")
axis(1,at=axTicks(1), labels=axTicks(1)/1000)
title(paste(el,"in O-horizon"),cex.main=1.2)
lines(vario.b,pch=1,type="p")
lines(vario.0,pch=2,type="p")
lines(vario.90,pch=3,type="p")
lines(v5.b,col=1,lwd=2,lty=1)
lines(v5.90,col=1,lwd=2,lty=2)
legend("bottomright", legend=c("Model omnidirectional","Model E-W","omnidirectional","N-S","E-W"),
pch=c(NA,NA,1,2,3), lty=c(1,2,NA,NA,NA),lwd=c(2,2,NA,NA,NA))
par(mar=c(1.5,1.5,1.5,1.5))
#################################################################################
# NEW Krige map: percentile scale
# generate plot
plot(X,Y,frame.plot=FALSE,xaxt="n",yaxt="n",xlab="",ylab="",type="n")
KrigeLegend(X,Y,dat,resol=100,vario=v5.b,type="percentile",whichcol="gray",
qutiles=c(0,0.05,0.25,0.50,0.75,0.90,0.95,1),borders="bordersKola",
leg.xpos.min=7.8e5,leg.xpos.max=8.0e5,leg.ypos.min=77.6e5,leg.ypos.max=78.7e5,
leg.title="mg/kg", leg.title.cex=0.7, leg.numb.cex=0.7, leg.round=3,
leg.numb.xshift=0.7e5,leg.perc.xshift=0.4e5,leg.perc.yshift=0.2e5,tit.xshift=0.35e5)
# plot background
plotbg(map.col=c("gray","gray","gray","gray"),map.lwd=c(1,1,1,1),add.plot=T)
# Text
text(min(X)+diff(range(X))*4/7,max(Y),"Pb",cex=1)
text(min(X)+diff(range(X))*4/7,max(Y)-diff(range(Y))/28,"in O-horizon",cex=0.8)
# scalebar
scalebar(761309,7373050,861309,7363050,shifttext=-0.5,shiftkm=37e3,sizetext=0.8)
# North arrow
Northarrow(362602,7818750,362602,7878750,362602,7838750,Alength=0.15,Aangle=15,Alwd=1.3,Tcex=1.6)
#################################################################################
# NEW Krige map: percentile scale
# generate plot
plot(X,Y,frame.plot=FALSE,xaxt="n",yaxt="n",xlab="",ylab="",type="n")
KrigeLegend(X,Y,dat,resol=100,vario=v5.90,type="percentile",whichcol="gray",
qutiles=c(0,0.05,0.25,0.50,0.75,0.90,0.95,1),borders="bordersKola",
leg.xpos.min=7.8e5,leg.xpos.max=8.0e5,leg.ypos.min=77.6e5,leg.ypos.max=78.7e5,
leg.title="mg/kg", leg.title.cex=0.7, leg.numb.cex=0.7, leg.round=3,
leg.numb.xshift=0.7e5,leg.perc.xshift=0.4e5,leg.perc.yshift=0.2e5,tit.xshift=0.35e5)
# plot background
plotbg(map.col=c("gray","gray","gray","gray"),map.lwd=c(1,1,1,1),add.plot=T)
# Text
text(min(X)+diff(range(X))*4/7,max(Y),"Pb",cex=1)
text(min(X)+diff(range(X))*4/7,max(Y)-diff(range(Y))/28,"in O-horizon",cex=0.8)
# scalebar
scalebar(761309,7373050,861309,7363050,shifttext=-0.5,shiftkm=37e3,sizetext=0.8)
# North arrow
Northarrow(362602,7818750,362602,7878750,362602,7838750,Alength=0.15,Aangle=15,Alwd=1.3,Tcex=1.6)
#################################################################################
# NEW map: Smoothing with percentile scale
# generate plot
plot(X,Y,frame.plot=FALSE,xaxt="n",yaxt="n",xlab="",ylab="",type="n")
SmoothLegend(X,Y,log10(dat),resol=200,type="percentile",whichcol="gray",
qutiles=c(0,0.05,0.25,0.50,0.75,0.90,0.95,1),borders="bordersKola",
leg.xpos.min=7.8e5,leg.xpos.max=8.0e5,leg.ypos.min=77.6e5,leg.ypos.max=78.7e5,
leg.title="mg/kg", leg.title.cex=0.7, leg.numb.cex=0.7, leg.round=2,leg.wid=4,
leg.numb.xshift=0.7e5,leg.perc.xshift=0.4e5,leg.perc.yshift=0.2e5,tit.xshift=0.35e5)
# plot background
plotbg(map.col=c("gray","gray","gray","gray"),map.lwd=c(1,1,1,1),add.plot=T)
# Text
text(min(X)+diff(range(X))*4/7,max(Y),"Pb",cex=1)
text(min(X)+diff(range(X))*4/7,max(Y)-diff(range(Y))/28,"in O-horizon",cex=0.8)
# scalebar
scalebar(761309,7373050,861309,7363050,shifttext=-0.5,shiftkm=37e3,sizetext=0.8)
# North arrow
Northarrow(362602,7818750,362602,7878750,362602,7838750,Alength=0.15,Aangle=15,Alwd=1.3,Tcex=1.6)
#################################################################################
dev.off()