library(StatDA)
data(chorizon)
X=chorizon[,"XCOO"]
Y=chorizon[,"YCOO"]
el=log10(chorizon[,"As"])
data(kola.background)
data(bordersKola)
# true representation of x and y axis of map for plot
xwid=diff(range(X))/12e4
ywid=diff(range(Y))/12e4
pdf("fig-5-6.pdf",width=2*xwid,height=1*ywid)
par(mfrow=c(1,2),mar=c(1.5,1.5,1.5,1.5))
######################################################################################
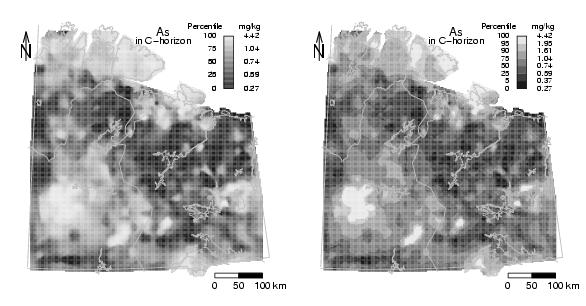
# NEW map: continuous grey scale
# generate plot
plot(X,Y,frame.plot=FALSE,xaxt="n",yaxt="n",xlab="",ylab="",type="n")
SmoothLegend(X,Y,el,resol=200,type="contin",whichcol="gray",
qutiles=c(0,0.05,0.25,0.50,0.75,0.90,0.95,1), borders="bordersKola",
leg.xpos.min=7.8e5,leg.xpos.max=8.0e5,leg.ypos.min=77.6e5,leg.ypos.max=78.7e5,
leg.title="mg/kg", leg.title.cex=0.7, leg.numb.cex=0.7, leg.round=2,leg.wid=4,
leg.numb.xshift=0.7e5,leg.perc.xshift=0.4e5,leg.perc.yshift=0.2e5,tit.xshift=0.35e5)
# plot background
plotbg(map.col=c("gray","gray","gray","gray"),map.lwd=c(1,1,1,1),add.plot=T)
# Text
text(min(X)+diff(range(X))*4/7,max(Y),"As",cex=1)
text(min(X)+diff(range(X))*4/7,max(Y)-diff(range(Y))/28,"in C-horizon",cex=0.8)
# scalebar
scalebar(761309,7373050,861309,7363050,shifttext=-0.5,shiftkm=37e3,sizetext=0.8)
# North arrow
Northarrow(362602,7818750,362602,7878750,362602,7838750,Alength=0.15,Aangle=15,Alwd=1.3,Tcex=1.6)
######################################################################################
# NEW map: percentile scale
# generate plot
plot(X,Y,frame.plot=FALSE,xaxt="n",yaxt="n",xlab="",ylab="",type="n")
SmoothLegend(X,Y,el,resol=200,type="percentile",whichcol="gray",
qutiles=c(0,0.05,0.25,0.50,0.75,0.90,0.95,1), borders="bordersKola",
leg.xpos.min=7.8e5,leg.xpos.max=8.0e5,leg.ypos.min=77.6e5,leg.ypos.max=78.7e5,
leg.title="mg/kg", leg.title.cex=0.7, leg.numb.cex=0.7, leg.round=2,leg.wid=4,
leg.numb.xshift=0.7e5,leg.perc.xshift=0.4e5,leg.perc.yshift=0.2e5,tit.xshift=0.35e5)
# plot background
plotbg(map.col=c("gray","gray","gray","gray"),map.lwd=c(1,1,1,1),add.plot=T)
# Text
text(min(X)+diff(range(X))*4/7,max(Y),"As",cex=1)
text(min(X)+diff(range(X))*4/7,max(Y)-diff(range(Y))/28,"in C-horizon",cex=0.8)
# scalebar
scalebar(761309,7373050,861309,7363050,shifttext=-0.5,shiftkm=37e3,sizetext=0.8)
# North arrow
Northarrow(362602,7818750,362602,7878750,362602,7838750,Alength=0.15,Aangle=15,Alwd=1.3,Tcex=1.6)
dev.off()