library(StatDA)
pdf("fig-5-3.pdf",width=9,height=4.5)
par(mfrow=c(1,1),mar=c(0,0,1,0))
# 1st set
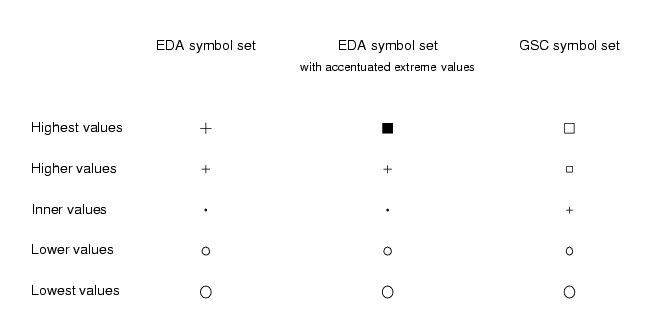
plot(-5,-2,xlim=c(-10,6.5),ylim=c(-2.5,4.5),axes=F,xlab="",ylab="",pch=EDA.symbol[1],cex=EDA.size[1])
points(-5,-1,pch=EDA.symbol[2],cex=EDA.size[2])
points(-5,0,pch=EDA.symbol[3],cex=EDA.size[3])
points(-5,1,pch=EDA.symbol[4],cex=EDA.size[4])
points(-5,2,pch=EDA.symbol[5],cex=EDA.size[5])
text(-5,4,"EDA symbol set",cex=1.2)
# 2nd set
points(0,-2,pch=EDAacc.symbol[1],cex=EDAacc.size[1])
points(0,-1,pch=EDAacc.symbol[2],cex=EDAacc.size[2])
points(0,0,pch=EDAacc.symbol[3],cex=EDAacc.size[3])
points(0,1,pch=EDAacc.symbol[4],cex=EDAacc.size[4])
points(0,2,pch=EDAacc.symbol[5],cex=EDAacc.size[5])
text(0,4,"EDA symbol set",cex=1.2)
text(0,3.5,"with accentuated extreme values")
# 3rd set
points(5,-2,pch=GSC.symbol[1],cex=GSC.size[1])
points(5,-1,pch=GSC.symbol[2],cex=GSC.size[2])
points(5,0,pch=GSC.symbol[3],cex=GSC.size[3])
points(5,1,pch=GSC.symbol[4],cex=GSC.size[4])
points(5,2,pch=GSC.symbol[5],cex=GSC.size[5])
text(5,4,"GSC symbol set",cex=1.2)
text(-10,2,"Highest values",cex=1.2,pos=4)
text(-10,1,"Higher values",cex=1.2,pos=4)
text(-10,0,"Inner values",cex=1.2,pos=4)
text(-10,-1,"Lower values",cex=1.2,pos=4)
text(-10,-2,"Lowest values",cex=1.2,pos=4)
dev.off()