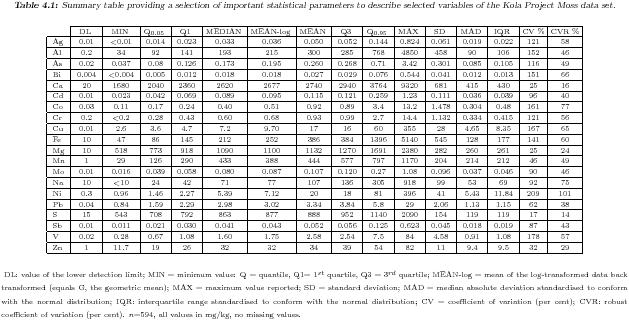
"cat.to.list" <-
function (x, a)
{
a <- as.character(a)
label <- unique(a)
out <- as.list(1:length(label))
names(out) <- label
for (k in 1:length(label)) {
out[[k]] <- x[label[k] == a]
if (length(out[[k]]) == 0)
out[[k]] <- NA
}
out
}
"descriptive" <-
function (x)
{
lab <- c("MIN", paste("Q_",quanlow <- c(0.05),sep=""),
"Q1", "MEDIAN", "MEAN-log", "MEAN", "Q3",
paste("Q_",quanup <- c(0.95),sep=""), "MAX",
"SD", "MAD", "IQR","CV %", "CVR %")
#lab <- c("N", "Missings", "MIN", paste("Q_",quanlow <- c(0.02,0.05,0.1),sep=""),
# "Q1", "MEDIAN", "MEAN-log", "MEAN", "Q3",
# paste("Q_",quanup <- c(0.9,0.95,0.98),sep=""), "MAX",
# "SD", "MAD", "IQR","CV", "CVR",
# "KS-norm", "SW-norm", "KS-lognorm", "SW-lognorm")
if (missing(x)) {
return(lab)
}
temp <- rep(0, length(lab))
xt <- x[!is.na(x)]
ix <- order(xt)
n <- length(xt)
if (!is.numeric(xt) || all(is.na(x))) {
#return(c(n, rep(NA, length(lab) - 2), length(x) - length(xt)))
return(c(rep(NA, length(lab) - 3), length(x) - length(xt)))
}
if (n == 1) {
#return(c(n, xt[1], NA, rep(xt[1], 5), length(x) - length(xt)))
return(c(NA, rep(xt[1], 5), length(x) - length(xt)))
}
else {
#return(c(n, length(x) - length(xt), min(xt), quantile(xt,quanlow),
return(c(min(xt), quantile(xt,quanlow),
quantile(xt,0.25), median(xt), exp(mean(log(xt[xt>0]))),
mean(xt), quantile(xt,0.75), quantile(xt,quanup), max(xt),
sd(xt), mad(xt), IQR(xt)/1.349,
sd(xt)/mean(xt)*100, mad(xt)/median(xt)*100))
}
}
"sumstats" <-
function (x, by)
{
if (!missing(by)) {
x <- cat.to.list(c(x), by)
}
if (!is.list(x) & !is.matrix(x))
x <- matrix(x, ncol = 1)
if (is.list(x)) {
nrow <- length(x)
out <- matrix(NA, nrow = nrow, ncol = length(descriptive()))
dimnames(out) <- list(names(x), descriptive())
for (j in (1:nrow)) {
if (is.numeric(x[[j]])) {
out[j,] <- descriptive(x[[j]])
}
}
return(out)
}
if (is.matrix(x)) {
nr <- ncol(x)
out <- matrix(NA, nrow = nr, ncol = length(descriptive()))
dimnames(out) <- list(dimnames(x)[[2]], descriptive())
for (j in (1:nr)) {
out[j, ] <- descriptive(x[, j])
}
return(out)
}
}
library(StatDA)
# Test:
data(moss)
sel=c("Ag","Al","As","Bi","Ca","Cd","Co","Cr","Cu","Fe","Mg","Mn","Mo","Na","Ni","Pb","S","Sb","V","Zn")
out <- sumstats(moss[,sel])
write.csv(signif(out,4),file="tab-4-1.csv")