library(StatDA)
data(chorizon)
Ba=chorizon[,"Ba"]
pdf("fig-3-15.pdf",paper="special",width=7,height=4.5)
par(mar=c(4,1,1,1))
par(mfrow=c(2,1))
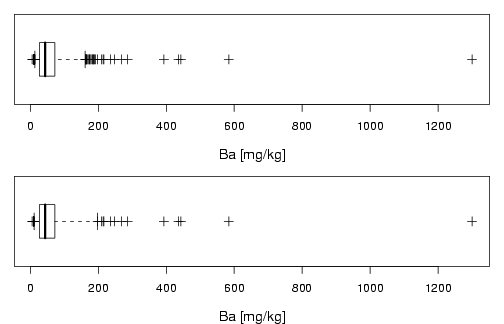
boxplotperc(Ba,quant=c(0.05,0.95),horizontal=T,xlab="Ba [mg/kg]",cex.lab=1.2,pch=3)
boxplotperc(Ba,quant=c(0.02,0.98),horizontal=T,xlab="Ba [mg/kg]",cex.lab=1.2,pch=3)
library(StatDA)
data(chorizon)
Ba=chorizon[,"Ba"]
pdf("fig-3-16.pdf",paper="special",width=7,height=2)
par(mar=c(4,1,1,1))
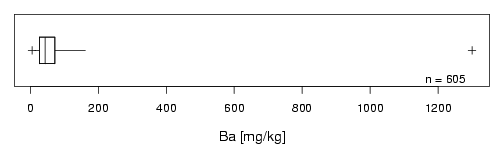
rg.boxplot(Ba,ifbw=T,colr=0,xlab="Ba [mg/kg]",cex.lab=1.2)
dev.off()