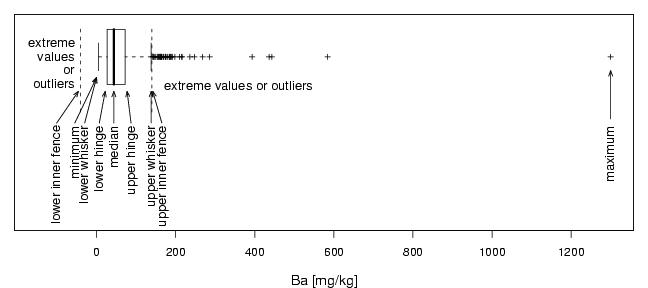
library(StatDA)
data(chorizon)
x=chorizon[,"Ba"]
pdf("fig-3-13.pdf",paper="special",width=9,height=4)
par(mar=c(4,1,1,1))
# Boxplot
plot(0,0,xlab="Ba [mg/kg]", cex.lab=1.2, xlim=c(-150,1300),
ylim=c(-0.2,1.25),yaxt="n",type="n",xaxt="n")
axis(1,at= xat <- seq(0,1400,by=200), labels=xat)
a=boxplot(x,conf=T, add=TRUE,horizontal=TRUE,pch=3,cex=0.7,yaxt="n",xaxt="n")
# Text
tcex=1.1
ypos=0.5
text(max(x),ypos,"maximum",cex=tcex,srt=90,adj=c(1,0.4))
arrows(max(x),ypos+0.05,max(x),0.9,length=0.08,angle=20)
text(min(x)-60,ypos,"minimum",cex=tcex,srt=90,adj=c(1,0.4))
arrows(min(x)-60,ypos+0.02,min(x)-5,0.85,length=0.08,angle=20)
text(a$stats[3],ypos,"median",cex=tcex,srt=90,adj=c(1,0.4))
arrows(a$stats[3],ypos+0.02,a$stats[3],0.75,length=0.08,angle=20)
text(a$stats[2]-20,ypos,"lower hinge",cex=tcex,srt=90,adj=c(1,0.4))
arrows(a$stats[2]-20,ypos+0.02,a$stats[2]-5,0.75,length=0.08,angle=20)
text(a$stats[4]+15,ypos,"upper hinge",cex=tcex,srt=90,adj=c(1,0.4))
arrows(a$stats[4]+15,ypos+0.02,a$stats[4]+5,0.75,length=0.08,angle=20)
text(a$stats[1]-35,ypos,"lower whisker",cex=tcex,srt=90,adj=c(1,0.4))
arrows(a$stats[1]-35,ypos+0.02,a$stats[1]-5,0.85,length=0.08,angle=20)
text(a$stats[5],ypos,"upper whisker",cex=tcex,srt=90,adj=c(1,0.4))
arrows(a$stats[5],ypos+0.02,a$stats[5],0.75,length=0.08,angle=20)
# IQR
iq=a$stats[4]-a$stats[2]
# far outliers:
farup=a$stats[4]+3*iq
# upper inner fence
text(a$stats[4]+1.5*iq+25,ypos,"upper inner fence",cex=tcex,srt=90,adj=c(1,0.4))
arrows(a$stats[4]+1.5*iq+25,ypos+0.02,a$stats[4]+1.5*iq+2,0.75,length=0.08,angle=20)
segments(a$stats[4]+1.5*iq,0.6,a$stats[4]+1.5*iq,1.2,lty=2)
# upper outliers
text(a$stats[4]+3*iq+150,0.87,"extreme values or outliers",cex=tcex,pos=1,srt=0,adj=c(0,0))
# lower inner fence
text(a$stats[2]-1.5*iq-60,ypos,"lower inner fence",cex=tcex,srt=90,adj=c(1,0.4))
arrows(a$stats[2]-1.5*iq-60,ypos+0.02,a$stats[2]-1.5*iq-5,0.75,length=0.08,angle=20)
segments(a$stats[2]-1.5*iq,0.6,a$stats[2]-1.5*iq,1.2,lty=2)
# lower outliers
text(a$stats[1]-60,1.1,"extreme",srt=0,cex=tcex,adj=c(1,0.4))
text(a$stats[1]-60,1.0,"values",srt=0,cex=tcex,adj=c(1,0.4))
text(a$stats[1]-60,0.9,"or",srt=0,cex=tcex,adj=c(1,0.4))
text(a$stats[1]-60,0.8,"outliers",srt=0,cex=tcex,adj=c(1,0.4))
dev.off()