library(StatDA)
data(chorizon)
# need data:
Au=chorizon$Au
n=length(Au)
pdf("fig-3-11.pdf",width=9,height=4.5)
par(mfcol=c(1,2),mar=c(4,4,2,2))
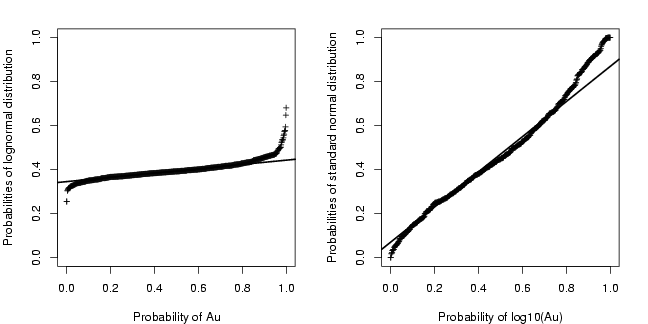
ppplot.das(Au,pdist=plnorm,xlab="Probability of Au",
ylab="Probabilities of lognormal distribution", pch=3,cex=0.7)
ppplot.das(log10(Au),pdist=pnorm,xlab="Probability of log10(Au)",
ylab="Probabilities of standard normal distribution", pch=3,cex=0.7)
dev.off()