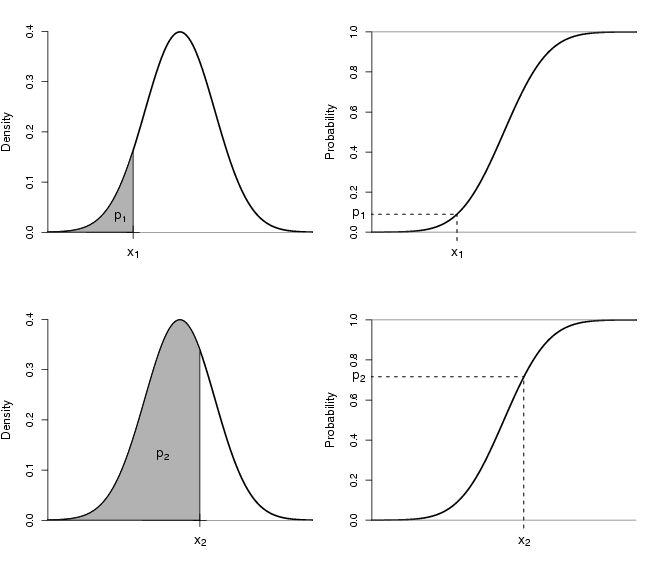
library(StatDA)
pdf("fig-3-6.pdf",width=9,height=8)
par(mfrow=c(2,2))
par(mar=c(4,4,2,1))
y=seq(-4,4,by=0.01)
ydens=dnorm(y)
p=pnorm(y)
plot(y,ydens,main="",xlab="",ylab="Density",xlim=c(-3.5,3.5),type="l",xaxt="n",lwd=2,
frame.plot=FALSE,cex.lab=1.2)
abline(h=0,col=gray(0.5))
ind1=round(length(y)/3)
x1=y[ind1]
polygon(c(y[1:ind1],x1),c(ydens[1:ind1],0),col=gray(0.7))
points(x1,0,pch=3,cex=2)
mtext(expression(x[1]),side=1,at=x1,las=1,line=0.5,cex=1.2)
text(-1.7,0.03,expression(p[1]),cex=1.3)
plot(y,p,main="",xlab="",ylab="Probability",xlim=c(-3.5,3.5),type="l",xaxt="n",lwd=2,
frame.plot=FALSE,cex.lab=1.2)
abline(h=c(0,1),col=gray(0.5))
p1=p[ind1]
mtext(expression(x[1]),side=1,at=x1,las=1,line=0.5,cex=1.2)
mtext(expression(p[1]),side=2,at=p1,las=1,line=0.5,cex=1.2)
segments(x1,-1,x1,p1,lty=2,lwd=1.2)
segments(-10,p1,x1,p1,lty=2,lwd=1.2)
plot(y,ydens,main="",xlab="",ylab="Density",xlim=c(-3.5,3.5),type="l",xaxt="n",lwd=2,
frame.plot=FALSE,cex.lab=1.2)
abline(h=0,col=gray(0.5))
ind2=round(length(y)*4/7)
x2=y[ind2]
polygon(c(y[1:ind2],x2),c(ydens[1:ind2],0),col=gray(0.7))
points(x2,0,pch=3,cex=2)
mtext(expression(x[2]),side=1,at=x2,las=1,line=0.5,cex=1.2)
text(-0.5,0.13,expression(p[2]),cex=1.3)
plot(y,p,main="",xlab="",ylab="Probability",xlim=c(-3.5,3.5),type="l",xaxt="n",lwd=2,
frame.plot=FALSE,cex.lab=1.2)
abline(h=c(0,1),col=gray(0.5))
p2=p[ind2]
mtext(expression(x[2]),side=1,at=x2,las=1,line=0.5,cex=1.2)
mtext(expression(p[2]),side=2,at=p2,las=1,line=0.5,cex=1.2)
segments(x2,-1,x2,p2,lty=2,lwd=1.2)
segments(-10,p2,x2,p2,lty=2,lwd=1.2)
dev.off()